
Top Best Network Monitoring Tools of 2021
If you don’t know the state of your network, you’re like a blind pilot, inevitably headed for disaster. Fortunately, the market now offers many good software solutions, both commercial and open source, for network monitoring.
With functionality such as discovering devices, monitoring network equipment, servers and applications, identifying network trends, graphically presenting monitoring results, and even backing up switch configurations and routers, these network monitoring software tools will surely surprise you. Here’s a list of the best network monitoring software solutions of 2021, both paid and free:
Paid Network Monitoring Solutions
PRTG
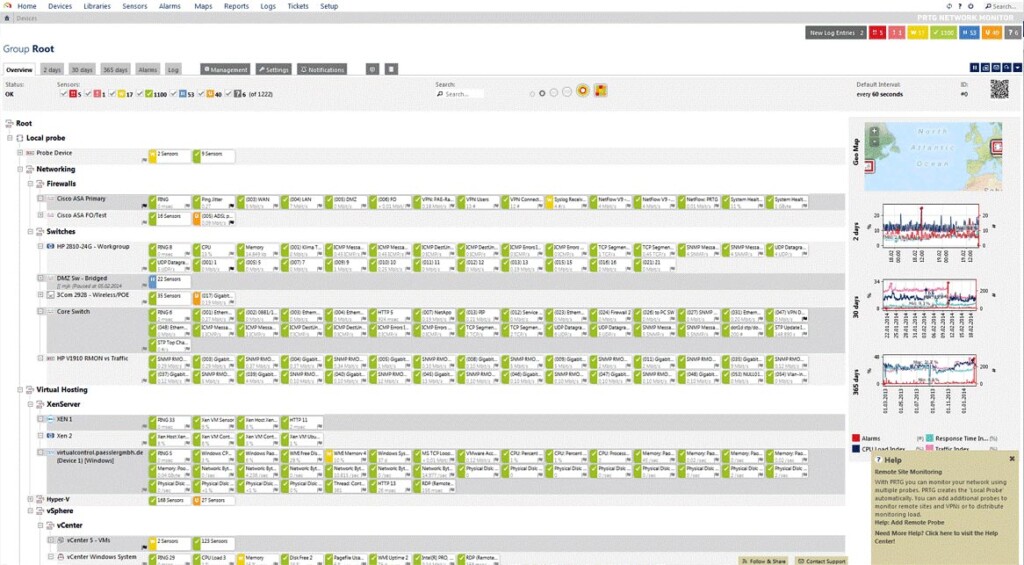
The Paessler PRTG network monitoring tool is an integrated solution suitable for both small and enterprise environments. The setup is dynamic, so its monitoring capabilities can grow or shrink with business size or other requirements of your organization. It is a Windows program that can be installed on a server with shared access.
PRTG is more than just a server monitoring solution; it can monitor any IT-related resources that connect to your network, including firewalls, servers, printers, switches, routers, databases, websites and even UPS’s. PRTG can send email and SMS alerts based on your custom threshold levels, so you can get more frequent warnings from critical servers and almost no noise from the others.
The application can monitor everything that you need to know about your server, such as CPU load, hard disk capacity and performance, RAM utilization, and bandwidth monitoring. The user interface is simple and clear, with functional elements conveniently located in intuitive places. Administrators can view the entire server environment at a glance through customizable dashboards and reports, generating useful graphs and analytics for specific needs. There are predefined templates to help with the configuration processes and speed the installation process. Other key features include flexible alerting methods, multiple user interfaces to choose from, failover-tolerant monitoring, and distributed monitoring.
With PRTG, there is no need to install agents on each device; monitoring can be performed only using the program kernel. Using remote probes allows monitoring of various networks, either in the same place or in remote locations. The remote computer collects location information and combines it on the PRTG central server, providing access to all local and remote devices, sensors, alerts and warnings via the internet, and uses a protocol with strong SSL encryption. The product is free for 100 sensors, so it’s great if you have a small network or looking for a paid solution.
WhatsUp Gold
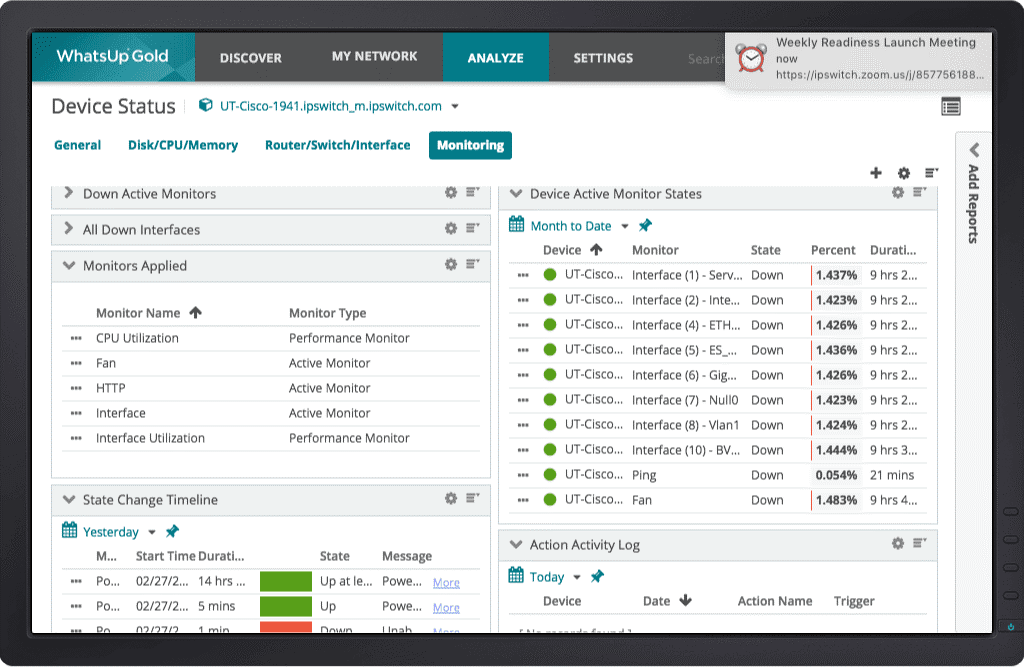
WhatsUp Gold is a powerful, easy-to-use software tool for comprehensive monitoring of applications, networks and systems. It allows you to troubleshoot problems before they affect the user experience. You can also get an accurate idea of the performance of your IT environment.
WhatsUp Gold has a unique interactive map that helps you quickly assess the performance of the entire network, infrastructure and virtual environment. It provides information about the connection status of network devices and dynamic response to interactions, which ensures minimum response time. The interactive maps can be dynamically filtered to get an instant overview of the physical, virtual and wireless networks. You can zoom in to view detailed information on individual sites or devices, or zoom out to see the subject of study in the overall picture. A map can be configured to display the environment by geography (on a map or on a building map), by category (by connection, application or traffic) or by any other layout.
Use of the tool starts with an advanced discovery process that identifies all devices connected to your network and automatically applies standard or custom device roles; this significantly speeds up the monitoring setup. WhatsUp Gold has active monitors that show device status in real time and passive monitors for SNMP traps, Syslog and Windows event logs. Performance monitors use SNMP, SSH or WMI to track CPU, disk, memory and network usage. WhatsUp Gold has an option to receive early warning when users are experiencing poor response times, so you can fix them before users experience full downtime. These warnings can be sent via email, SMS and web.
It also has a network traffic analysis module that collects network traffic and bandwidth usage data from any flow-enabled device on the network. One of the greatest performance management features is an action policy that detects a state change, such as when a router goes down, and immediately writes a log entry or starts an action script to reboot the system several minutes later and then sends an email notification after completion.
WhatsUp Gold has no free version but it has a free trial.
Nagios XI
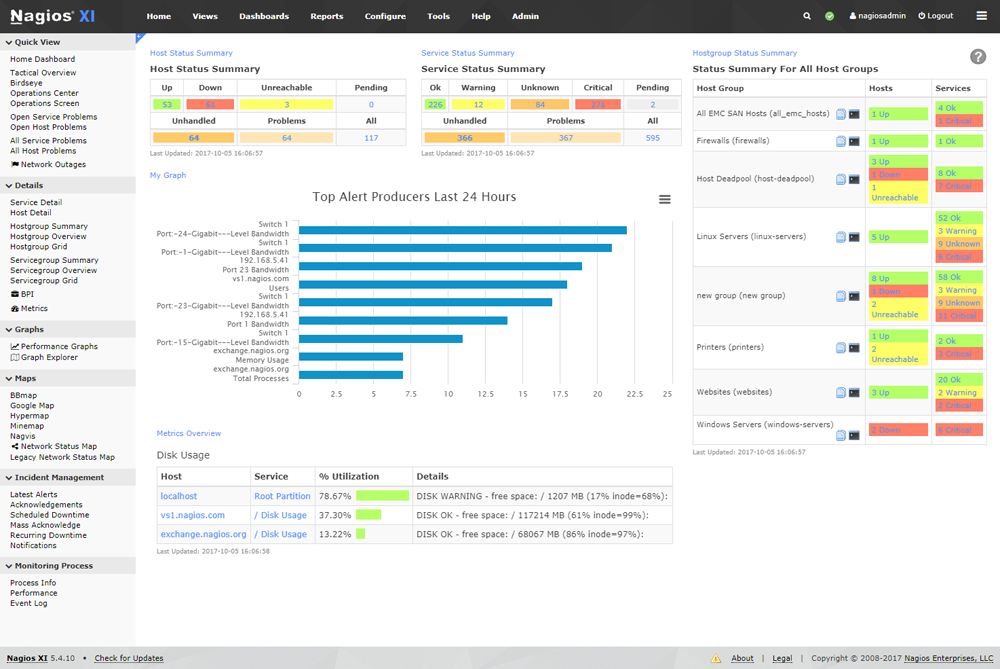
Nagios XI is a powerful network monitoring tool that has been in active development for many years. The Nagios Core software is open source and free, and Nagios XI is a proprietary interface that uses Nagios Core as the back end. Nagios XI does almost anything that system and network administrators might need from a network monitoring utility. The web interface is fast and intuitive, and the server part is extremely reliable. Its rather complex configuration can be a problem for beginners to learn, but it is also an advantage, since the tool can be adapted to almost any monitoring task. A very active community supports Nagios Core, so various plug-ins exist for a huge variety of hardware and software. You can continuously monitor the status of servers, services, network channels and anything else that has an IP address. For example, you can monitor the use of disk space on the server, RAM and CPU usage, FLEXlm license usage (software license manager tool), server air temperature, WAN and internet connection latencies, netflow traffic, and much more.
No monitoring system for servers and networks would be complete without notifications. The Nagios software platform offers a customizable mechanism for notifications via e-mail, SMS and instant messaging via the most popular internet messengers, as well as an escalation scheme that can be used to make reasonable decisions about who should be notified when and in what circumstances. In addition, the display function shows all monitored devices in the logical representation of their placement on the network, with color coding that highlights problems as they arise.
The main disadvantage of Nagios XI is its configuration process — it is mostly done through the command line, which greatly complicates installation if you’ve never worked with it before. People familiar with standard Linux and Unix configuration files, however, should not experience any particular problems. The possibilities of Nagios XI are huge, but the effort required to use some of them may not always be worth it. Nevertheless, the advantages of the early warning system metrics provided by this tool for so many aspects of the network are hard to overstate.
Nagios XI is available free of charge for monitoring small environments.
LogicMonitor
LogicMonitor is a SaaS service for monitoring physical, virtual and cloud-based networks. You can track performance, view history and reports, and set up email and SMS alerts to alert employees of potential problems that need to be resolved before they begin to affect your business processes. Users need to install a lightweight program on a Linux or Windows OS. LogicMonitor provides a single web console that is ready to automatically discover most switches, routers, firewalls, load balancers, servers, applications, databases, VoIP systems and storages. The dashboard allows users to monitor live performance indicators along with a list of system errors and statuses because it automatically collects performance data from connected servers, networks and workstations via over 20 standard protocols such as JMX, Perfmon, SNMP, WMI and various APIs. Network administrators can prioritize issues, configure escalation rules for alerts and schedule downtime according to their service standards.
LogicMonitor has reporting capabilities as well; you can build reports on any time period for any device, group, service or data source. Reports can be in HTML, PDF or CSV, and can be executed on demand or scheduled to be delivered by email at regular intervals. You have to know what you’re looking for before you configure a report. All in all, LogicMonitor is a powerful infrastructure monitoring and alerting service with a nicely customizable web portal that displays in-depth metrics and system information.
Unlike many other vendors, LogicMonitor doesn’t charge you per monitor; they charge based on the number of devices.

Netwrix Auditor for Network Devices
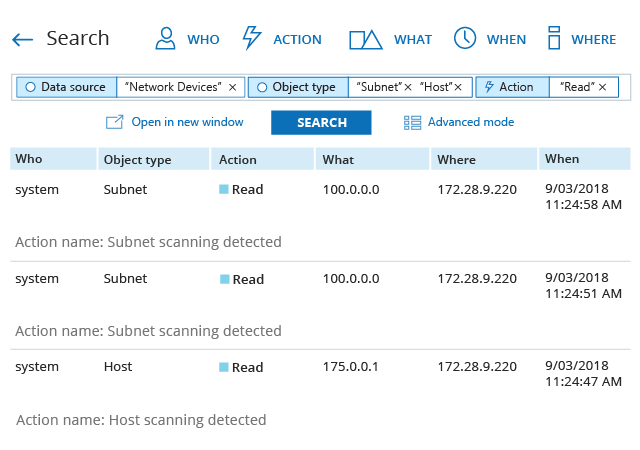
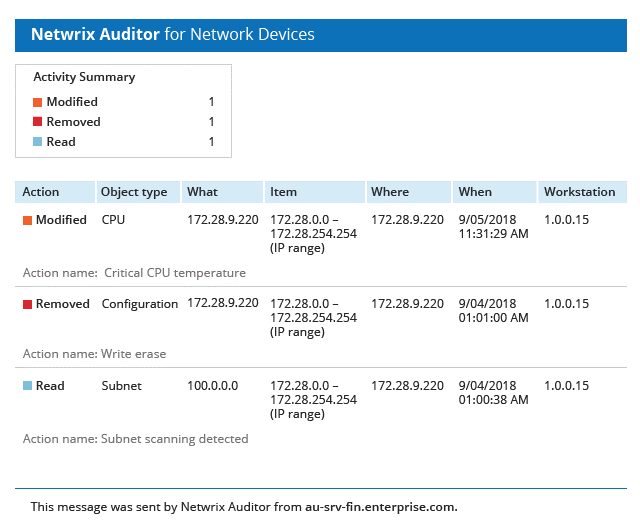
It’s not enough to detect network device performance issues — system administrators need to quickly determine the cause of the issue and fix it. To do that, they need to be able to inspect configuration changes and other activity. Netwrix Auditor for Network Devices delivers reports and alerts detailing what was changed on each network device, who made each change and when it happened, with the before and after values. The reports also reveal both successful and failed attempts to log on to network devices, directly or over VPN connections. In addition, they provide port scanning information and details about hardware issues such as a power supply failure or critical CPU temperature. Netwrix Auditor supports Fortinet FortiGate, Cisco ASA, Cisco IOS, Palo Alto, SonicWall and Juniper network devices.
Netwrix Auditor has a powerful built-in search of audit data, alerts on threat patterns, and behavior anomaly discovery functionality. It also has a RESTFul API engine that enables you to connect the Netwrix Auditor platform with other software solutions, such as Nutanix, Amazon Web Services, ServiceNow, ArchSight, IBM Qradar, Splunk, Alien Vault and LogRythm; you can receive data from or send data to these solutions. Product installation is straightforward, and the UI is user friendly and fast.
In short, Netwrix Auditor for Network Devices is not just a really valuable monitoring tool; it’s an enterprise-level software platform that gives you complete visibility into changes, configurations and access across your network infrastructure. Netwrix Auditor has free 20-day trial; during that period, you can not only evaluate Netwrix Auditor for Network Devices but also all the other Netwrix Auditor applications, which cover systems such as Active Directory, Group Policy, Azure AD, Exchange, Office 365, file servers, SharePoint, Microsoft SQL Server and VMware.
ntopng
ntopng is a network monitoring tool with a fast and easy web interface. This network probe shows network usage in a way similar to what the top command does for processes in Unix-like operation systems. In interactive mode, it displays the network status on the user’s terminal. In web mode, it acts as a web server, creating a HTML dump of the network status.
This packet analysis tool displays real-time data about network traffic, showing information about host data flows and host connections in real time. It provides legible graphs and tables showing current and past network traffic, including the protocol, source, purpose and history of specific transactions. In addition, you will find an impressive set of graphs, charts and maps of real-time network usage.
A modular architecture allows you to wire up a huge number of add-ons. The tool includes an API for the Lua scripting language, which can be used to support extensions. It can also store host data in files for permanent data collection. One of the most useful applications of ntopng is traffic control in a specific location. For example, when some of your network channels on your network map are highlighted in red and you don’t know why, you can use ntopng to get a per-minute report about the problematic network segment and quickly see which hosts are responsible for the issue. The advantage of such visibility of the network is difficult to overstate, and it is very easy to get.
There is a free, open-source Community edition of ntopng that is suitable for small businesses.

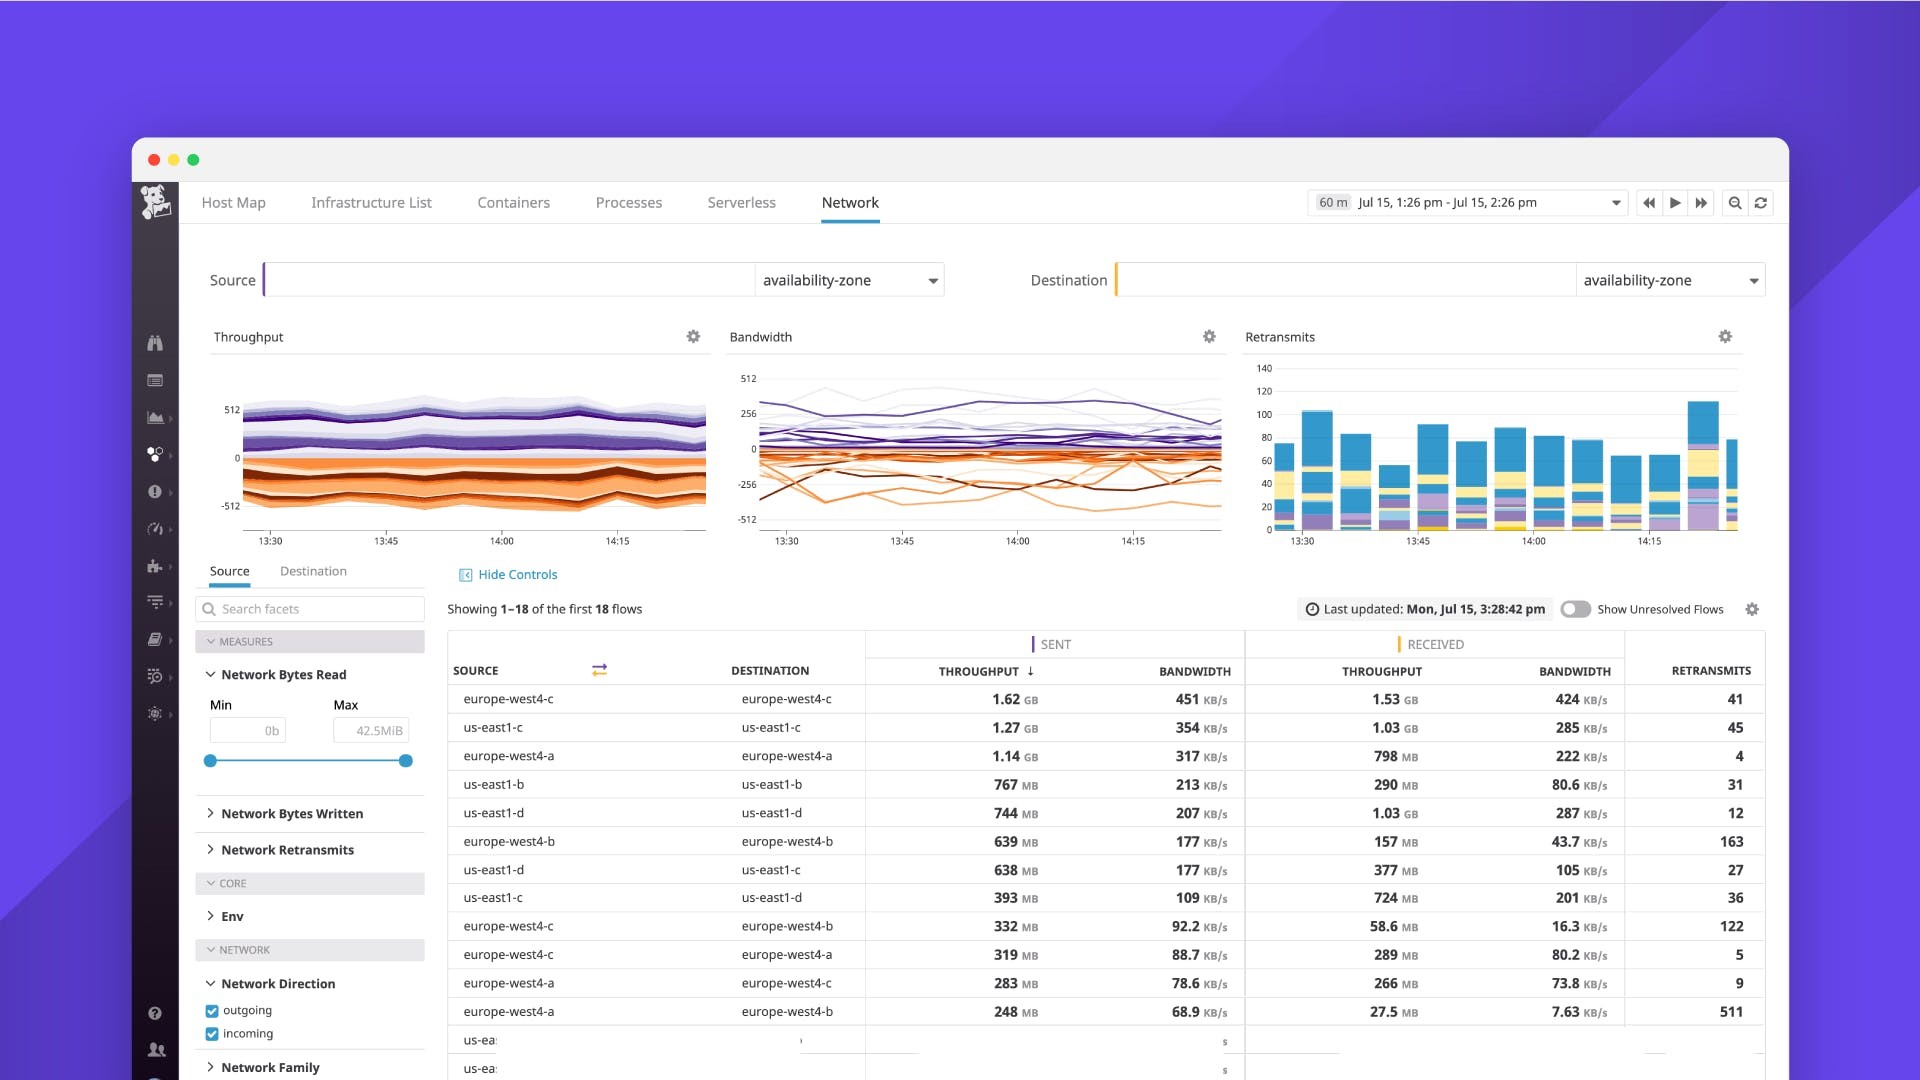
Datadog
Datadog is a platform that provides monitoring and analytics for software developers, operations teams and business leaders in the cloud era. The SaaS platform integrates and automates infrastructure monitoring, application performance monitoring and event log management to provide unified real-time visibility into the entire technology stack of a company’s customers. With over 120 integrations and a robust API, Datadog ties together metrics and events from every component in the environment to provide teams with graphing, correlation and data analysis. The product provides a single view for on-premises and cloud deployments. This holistic view of an enterprise’s IT infrastructure is becoming increasingly important with the ever-growing volume of data and devices within organizations. Businesses of all sizes and across a wide range of industries are using Datadog to digitally and migrate to the cloud, foster collaboration between teams, accelerate time to market for applications, reduce time spent solving problems, better understand user behavior and track key business metrics.
Datadog can monitor Linux and Windows virtual machines (VMs), standalone Linux and Windows servers, and Windows 7 and Windows 10 workstations. It provides access to configuration files for various monitored objects, including Apache, Microsoft IIS and SQL Server, VMware vSphere, Windows Services, and a variety of network devices. However, cloud services are the primary monitoring framework for Datadog, and the product supports common services including Amazon Web Services (AWS), Microsoft Azure and Google Cloud. The level of effort required to configure each of these services obviously depends on the service, but in many cases, it simply involves setting up connection information and credentials.
Datadog is subscription-based service with annual, monthly and hourly plans available. Depending on your plan, you can monitor 10 or 20 containers free for each host license. Additional containers will be billed at $0.002 per container per hour. In addition, you can purchase prepaid containers. The free version allows you to monitor up to 5 hosts and provides 1-day data retention.
Lansweeper
Lansweeper gathers hardware and software information of computers and other devices on a network for management, compliance and audit purposes. The application also includes a ticket-based helpdesk system and capabilities for software updates on target devices.
Lansweeper’s core capacity stems from the discovery of the hardware and software in a local area network (LAN). Lansweeper can collect information on all Windows, Linux and Mac devices, as well as network IP addressable devices. The inventory reports can be used to identify problems.
The central Lansweeper inventory database must be located on a Microsoft Windows machine in a SQL Compact or SQL Server database. The application can scale up to hundreds of thousands of units, while a minimum standard configuration can be supported by placing all its components on a single server. While Lansweeper can be set up as agentless, agents may be recommended for complex environments.
The integrated helpdesk ticketing module that can be used to capture and track issues, and the software module can help you manage updates and patches.
Lansweeper has a freeware product version, but the number of devices and the functionality provided are both limited. The full, licensed version offers a 20-day free trial.

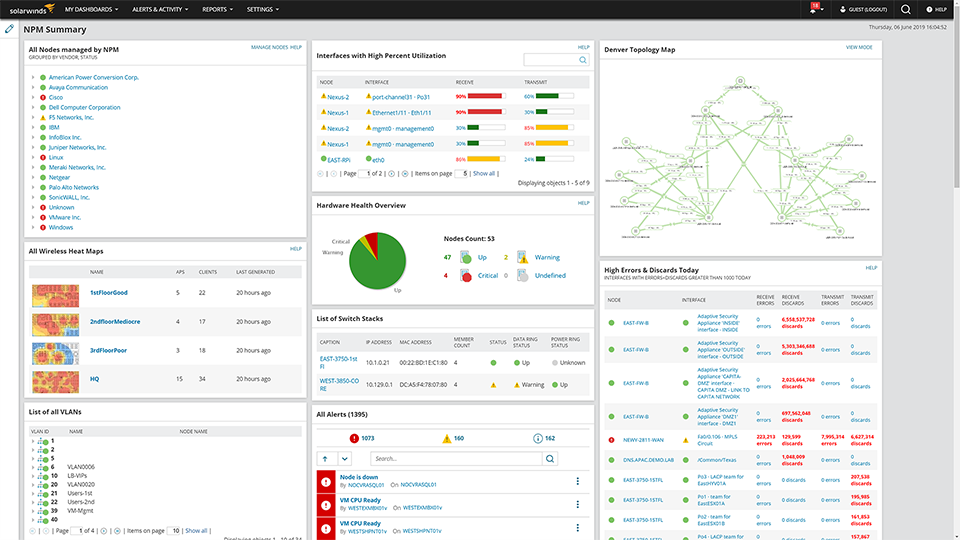
SolarWinds Network Performance Monitor
SolarWinds Network Performance Monitor quickly detects, diagnoses and assists in resolving network performance problems before they result in downtime. In addition, with dynamic network topology maps and automatic detection of components, administrators can easily scale the network and align important processes as it grows. SolarWinds Network Performance Monitor controls the response time, availability and uptime of routers, switches and other SNMP-enabled devices. It has automated network scanning processes that identify new network devices and monitor the state of all critical equipment. It supports networks and devices from leading hardware manufacturers. The monitoring process looks for the availability and performance indicators of network devices and interfaces, such as bandwidth load, delays, responses, packet loss, CPU and memory for each piece of equipment, with SNMP and WMI support.
You can quickly configure alerts based on events and the conditions of network devices. If necessary, you can block notifications based on dependencies and topology so you receive alerts on important network issues only. The solution also includes tools for generating notifications, reports, manuals and help files in different file formats. The user interface is simple to understand yet robust enough to provide a comprehensive view of the network. It is easy to see everything at a glance, and the statistical network baselines provide additional information to help you optimize network devices and respond to issues quickly. SolarWinds Network Performance Monitor has a NetPath feature that uses advanced probing to make troubleshooting network performance problems easier. With this feature, sysadmins can detect the network path from a source computer and trace it all the way to the destination service. NetPath works even when traceroute does not.
SolarWinds Network Performance Monitor has a 30-day free trial.
Observium
Observium is a low-maintenance network monitoring platform that automatically discovers and supports a wide range of device types, platforms and operating systems. It provides a powerful yet simple and intuitive interface to the health and status of your network.
The tool is capable of discovering, monitoring and managing your network via SNMP, CDP or LLDP. TrustRadius reviewers highlight that Observium is easy to set up, use and understand, and that right after its connection to the device, it initiates monitoring and graphic tracing. However, due to its overall scale, it is mostly suitable for medium to large networks.
The list of supported devices is huge and is not limited to network devices; it includes Cisco, Windows, Linux, HP, Juniper, Dell, FreeBSD, Brocade, Netscaler and NetApp. The main condition is that the device supports SNMP. But the collected information can be supplemented by other methods and protocols, such as syslog, rancid, collectd, smokeping and nfsen. Observium supports monitoring of sensors via IPMI protocol and offers monitoring of services such as Apache, Nginx, Mysql and Bind through a Unix agent. It also supports monitoring of virtualized systems.
The paid version has a process for active notifications. It will not replace real-time notification, since it is limited to 5-minute intervals for polling devices, but it can cover 60% of notification needs, and for systems with a small (<50) number of devices, it can be a solid choice.
Observium offers a free Community edition and two types of commercial subscriptions. Additionally, developers offer paid support of product installation, additional feature development and tech support.
Open-source adepts can also check LibreNMS, a community-based fork of the last GPL-licensed version of Observium.
Free and Open-Source Network Monitoring Solutions
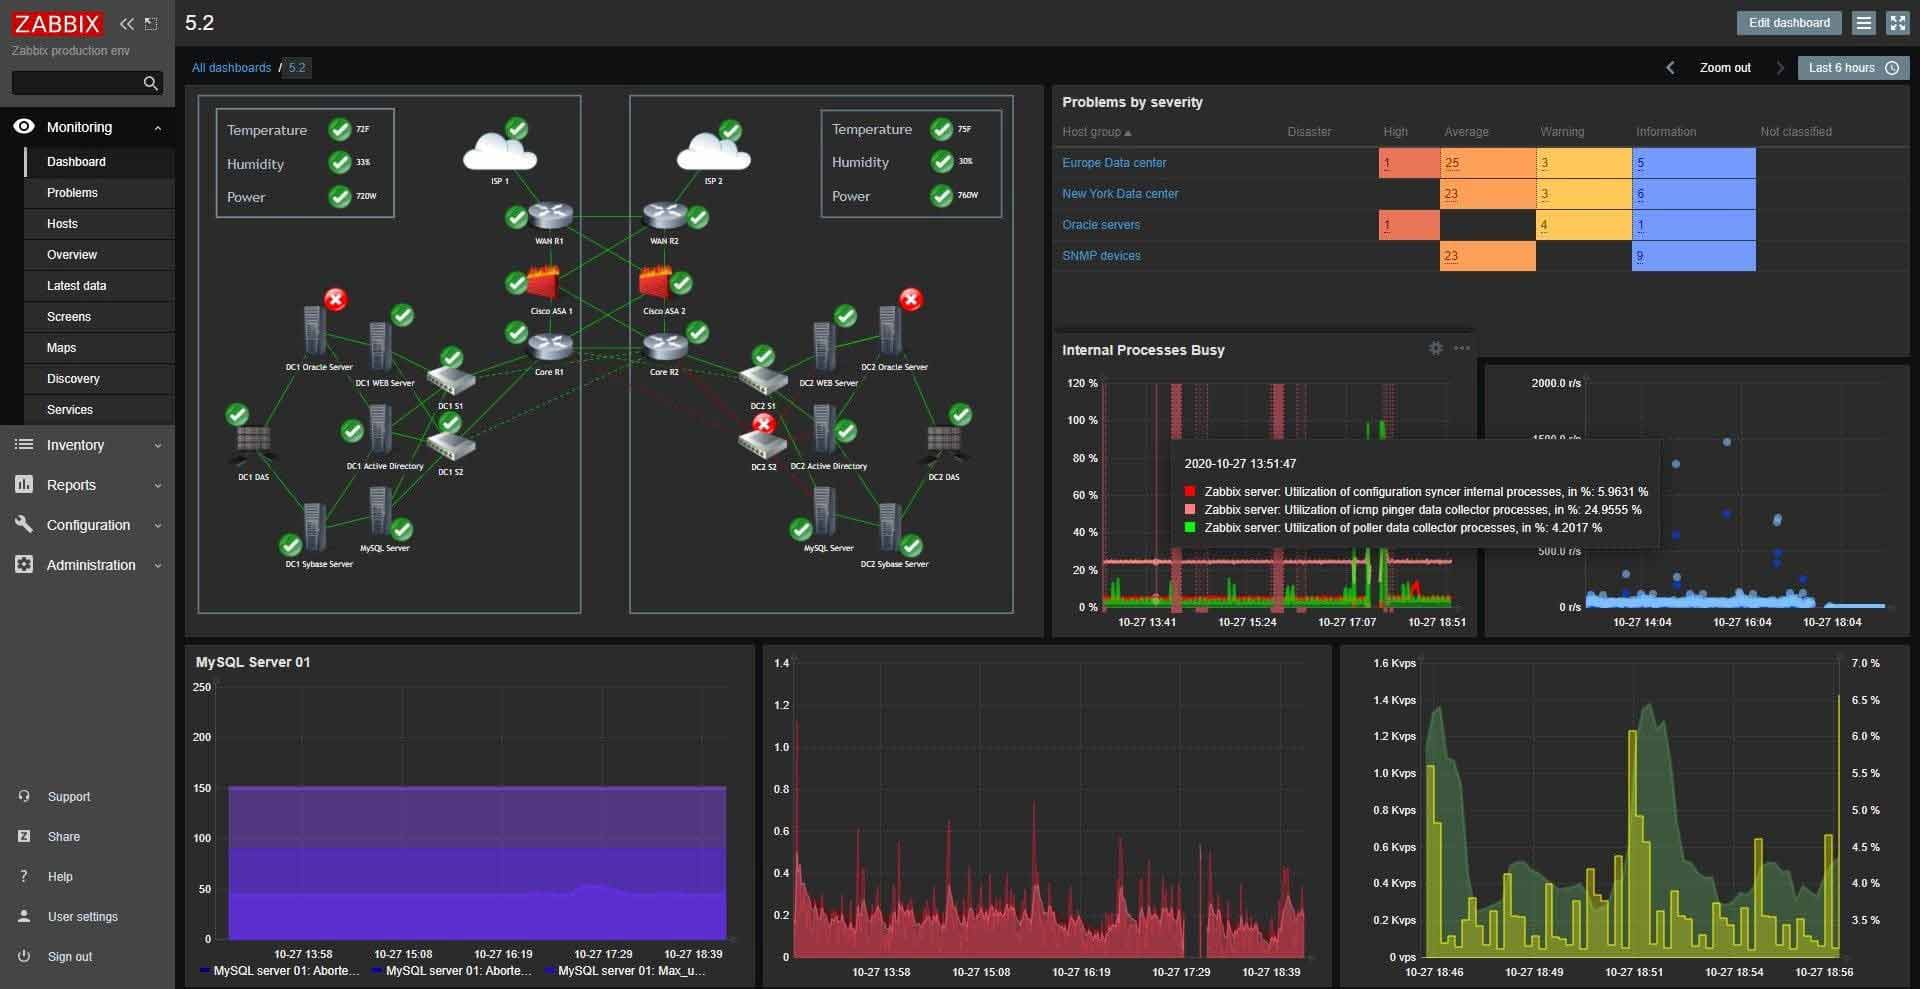
Zabbix
Zabbix is a full-scale tool for network and system monitoring that combines several options in one web console. It can be configured to monitor and collect data from a wide variety of servers and network devices, and it provides service and performance monitoring of each object. Zabbix enables you to monitor servers and networks with a wide range of technologies, including virtualization hypervisors and web application stacks. Zabbix supports VMware, Hyper-V and other virtualization hypervisors, providing detailed information about the performance and availability of the hypervisor and its activity. In particular, it can monitor Java application servers, web services and databases. New monitoring hosts can be added manually or through an automatic discovery process. A wide range of templates are applied by default, such as those for Linux, FreeBSD and Windows Server operating systems and for SMTP, HTTP, ICMP and IPMI protocols.
Zabbix must be installed and configured manually, component by component, on a Linux system or a virtual machine on a hypervisor. The user interface is not very clear and uses complicated terminology. There is no client program because it is accessed via HTTPS or SSH, but there is a mobile application available. The network device discovery process does not have the ability to browse the network and discover existing devices during product installation; this can be done later using certain protocols.
This solution can work without agents, using the SNMP protocol, but running an agent on each device makes using Zabbix a bit easier. However, it’s difficult and time-consuming to install agents on hundreds or even thousands of devices, and there are certain basic devices, like printers, where installation of agents is impossible.
Zabbix allows you to customize the dashboard and web interface to focus on the most important components of the network. Notifications can be based on custom actions that apply to a host or host groups. You can configure actions that will run remote commands if certain event criteria are met. The program displays network bandwidth usage and CPU utilization graphs. In addition, Zabbix supports custom maps, screens and even slideshows that show the current status of monitored devices. Zabbix can be difficult to implement at the initial stage, but the use of automatic detection and various templates can reduce the challenge. In addition to the installation package, Zabbix is available as a virtual device for several popular hypervisors.
The product is free, but complex, so you will likely need paid support.
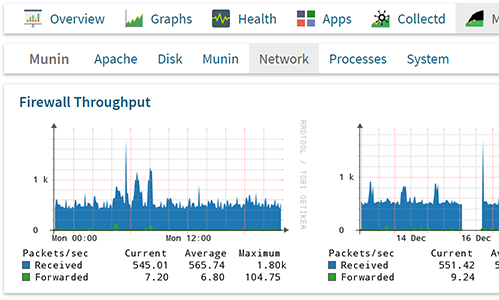
Cacti
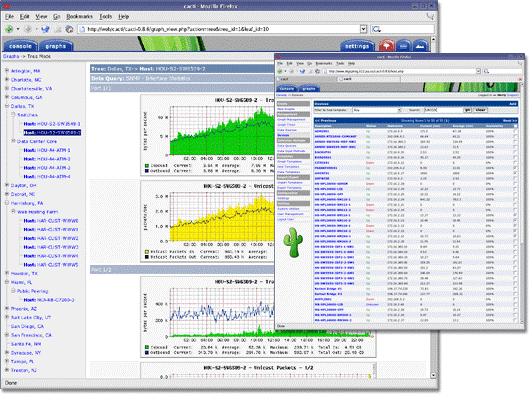
Cacti is a great network monitoring software tool for graphical representation of the network. Cacti is a free network monitoring solution and is included in the LAMP (Linux, Apache, MySQL, PHP) suite, which provides a standardized software platform for building graphs based on any statistical data. If a network device returns numeric data, then most likely it can be integrated into Cacti. There are templates for network monitoring platforms like Cisco routers and switches. Basically any network device that communicates with the SNMP (Simple Network Management Protocol) can be monitored by Cacti. In addition, scripts in Perl or PHP can also be used for monitoring. Cacti performs availability and performance monitoring of servers, services and network devices. It also tracks the workload and availability of network channels.
The central link in this system is graphs — all controlled parameters and settings are somehow tied to the graphs. Graphs of statistics are presented in the form of a tree in which graphs are grouped by their criteria. All graphs can be quickly created using supplied templates. Templates are one of the big advantages of Cacti; the user just selects a template and the graph is ready. Each graph is described by two elements: settings that define the properties of the graph, and elements that define the data that should be represented on it. Information displayed on the chart can be refined on the fly; for example, you can quickly view the data for the past few years to see if the current behavior of the network equipment or server is abnormal. And with the help of the Network Weathermap, a PHP plug-in for Cacti, you can create real-time maps of your network that show the load of communication channels between network devices.
In short, Cacti is a toolkit with extensive capabilities for graphical display and analysis of network performance trends that can be used to monitor almost any monitored metric that can be represented in a graph. However, this solution supports almost limitless tuning possibilities, which can make it too difficult for certain apps.
Spiceworks Network Monitor
Spiceworks Network Monitor is extremely flexible and scalable, allowing independent thresholds per system or device, so it is a great solution for more granular monitoring of memory, disk activity and more. The software is quick and easy to implement. It runs on a VM or a physical box. It’s pretty light on resources, though it can eat up a bunch of disk space; if it is co-located with another app, the drive can fill quickly if you don’t keep up with the logs or automate cleanup. The software is agentless, so there is little to no impact on the monitored devices. It can even monitor SNMP traps from switches, printers, copiers and other devices. It does a great job of monitoring during off hours.
Spiceworks Network Monitor tracks infrastructure devices, such as switches and routers, for input/output rate, packets per second and packet loss. It also tracks servers for CPU utilization, disk utilization, network data rate and packet loss, and memory utilization. You can drill down to display those parameters graphically in expanded views. However, Spiceworks Network Monitor does not monitor or manage other devices, including, most notably, mobile ones.
You can choose to look at specific devices in significantly more detail with the Critical Device Widget. You can click a specific parameter in the Critical Device window, and the graph for that parameter is expanded and additional details show up on the screen, such as exact numbers for the total switch bandwidth usage with the stats at each point where the numbers changed.
There are a few disadvantages. Spiceworks Network Monitor provides excellent basic monitoring, but it doesn’t support SNMP version 3. The software does not reconcile systems that are going down — sometimes when connection links go down, they do not go back up in the software though physically they are up again, so they must be deleted and re-added. And the user interface is rather slow. However, the software is no-cost so there is no risk in giving it a try.

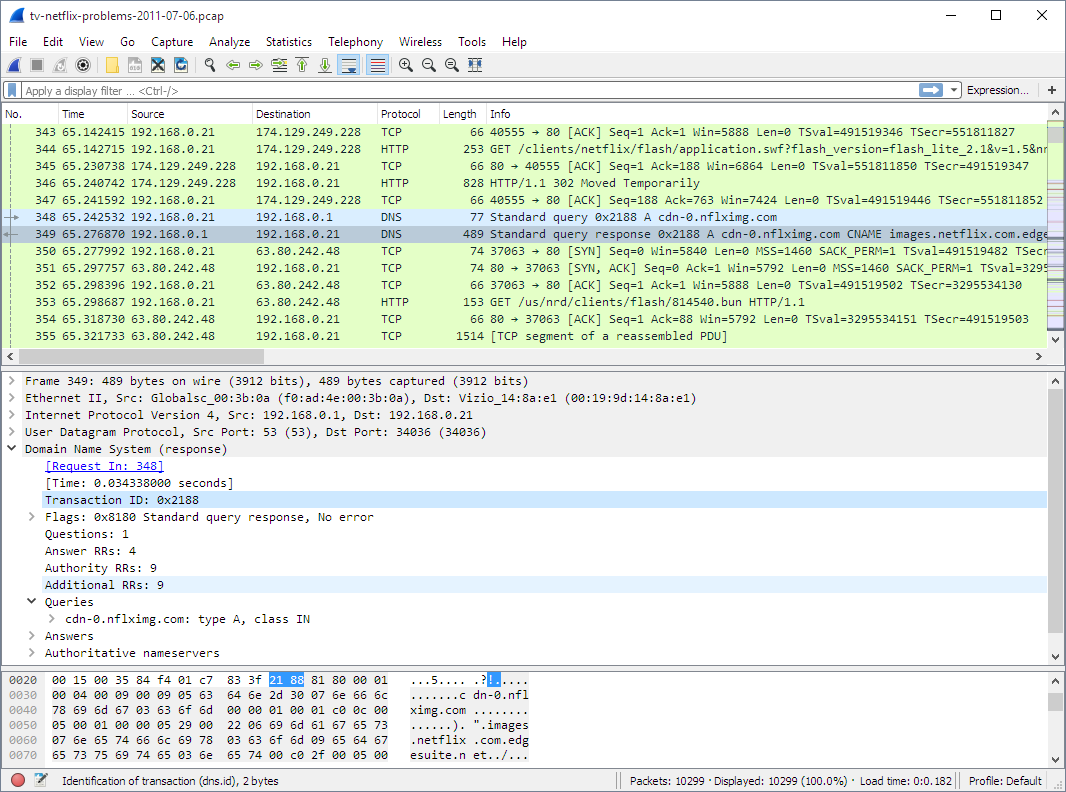
Wireshark
Wireshark is a well-known network traffic monitoring tool. It works with the overwhelming majority of known protocols, and it has a clear and logical graphical interface based on GTK + and a powerful filter system. Moreover, it is cross-platform, working under Linux, Solaris, FreeBSD, NetBSD, OpenBSD, Mac OS X and, of course, Windows. Basically, Wireshark is a packet sniffing tool that reveals the smallest details of network traffic and network protocols. You can analyze pcap files and TCP connection, see packet contents, and search for specific packets in the netflow. If you have the necessary knowledge, you can effectively troubleshoot and diagnose a variety of problems that arise in the network using Wireshark.
Like all tools described in this section, Wireshark is free.
Netwrix Auditor Free Community Edition
Every business-critical device and service must be correctly configured, and its availability, protection and settings integrity must be constantly monitored. Netwrix Auditor Free Community Edition is a free monitoring tool that gives IT administrators regular updates about all important changes, logon attempts and events on their network devices. The daily activity summary reports provide the crucial “what,” “when” and “where” details and before and after values for changes on your monitored assets, as well as other necessary event details.
Like the paid version of Netwrix Auditor, Netwrix Auditor Free Community Edition is not just a network device monitoring tool. Rather, it’s a platform that covers many different systems, from Active Directory to Oracle Databases, and provides a wide variety of actionable reports on your infrastructure changes and events.
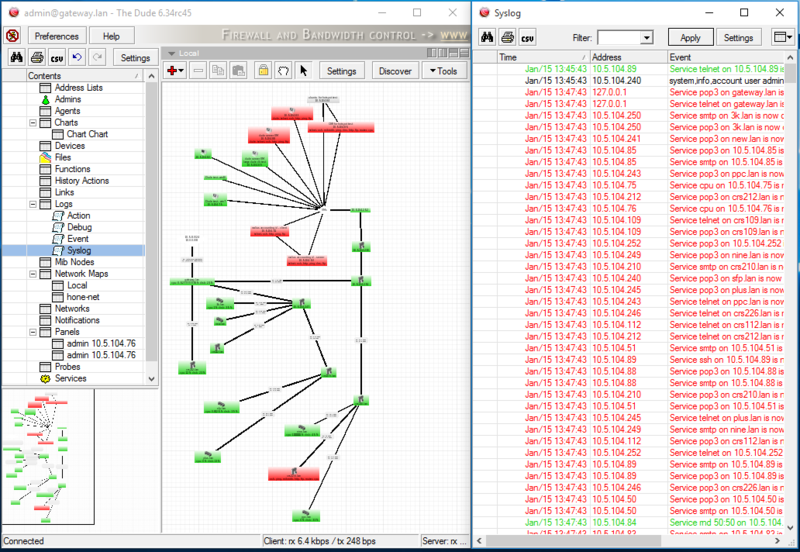
The Dude
The Dude is a network monitor from the Latvian company MikroTik that can significantly improve the performance of the network environment. MikroTik products have found popularity in small and medium businesses due to their low price tag, wealth of configuration capabilities and exceptional build quality.
The Dude automatically scans all devices on specific subnets, draws and assembles a network map, monitors device services, and alerts you if a service has problems. You can not only control your devices, but also manage them. You can mass-update devices on RouterOS and configure them directly from the client. The software supports SNMP, ICMP, DNS and TCP monitoring for devices.
The Dude is easy to install, features automatic network discovery that detects the type or brand of device, allows you to create your own maps, and enables you to add custom devices. The solution works in Linux Wine, macOS Darwine and Windows environments.
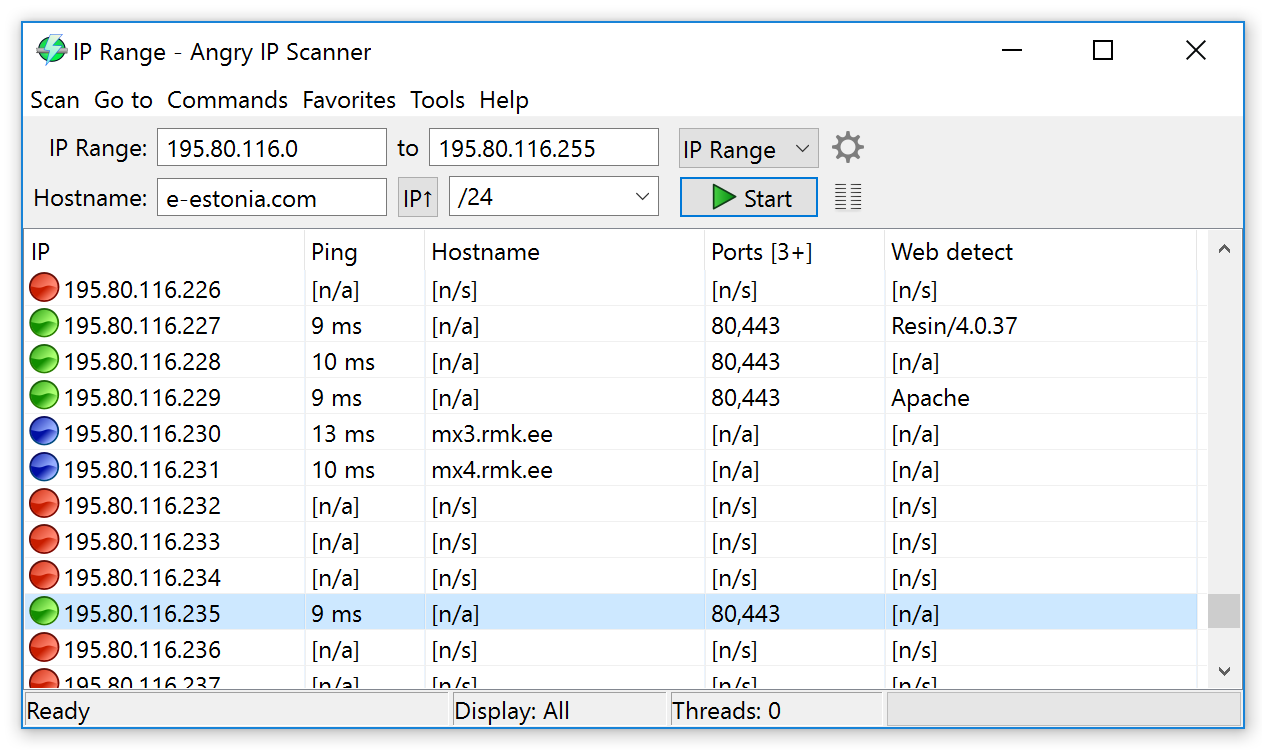
Angry IP Scanner
Angry IP Scanner is a fast and lightweight tool that provides all the features you’d expect from an advanced network scanner. If a device has ever lost its IP address on your network, you know the frustration of trying to find that device remotely. Angry IP makes scanning your LAN simple: Set the range of IP addresses you’d like to scan and click Start. In seconds, your list will fill with your network devices, along with each device’s ping time, open ports, MAC address and hostname. You can save favorite IP ranges and hostnames without having to sign in to an online account; your favorite information will be stored locally and can easily be saved to your network or cloud drive.
If you’re looking to scan your web server or an external IP address, you can do so from the exact same interface, and once you’ve found what you’re looking for, you can export your results to CSV, TXT or XML format. Angry IP’s open-source code allows advanced users to analyze the code and build their own plug-ins to extend the functionality of the network scanner.
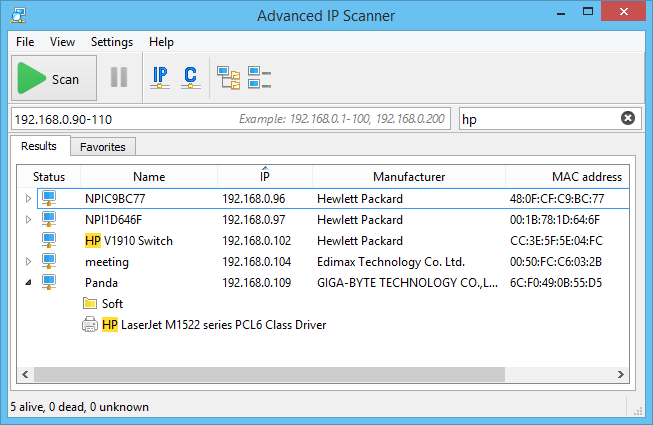
Advanced IP Scanner
Advanced IP Scanner is a free, fast and powerful network scanner with a user-friendly interface. In a matter of seconds, Advanced IP Scanner can locate all the computers on your wired or wireless local network and conduct a scan of their ports. The program provides easy access to various network resources, such as HTTP, HTTPS, FTP and shared folders. It also enables you to detect all the IP addresses on your Wi-Fi network.
The remote PC shutdown feature lets you shut down any remote computer or group of computers running Windows. You can also wake these machines up remotely, provided their network cards support the Wake-On-LAN function. You can scan RDP resources and access them directly from Advanced IP Scanner, and as well as run ping, tracert, and SSH commands on a selected computer.
One of the stand-out features of Advanced IP Scanner is its native integration with Radmin remote control software. IP Scanner lets you scan your network, find all computers running Radmin Server, and connect to any of them in Full Control, File Transfer or Telnet mode, with one click. For simpler batch operations on a subset of computers, you can add machines to a list of favorites, and Advanced IP Scanner will automatically load the list at startup. You can choose whether to scan your entire network or just the computers in a Favorites list.
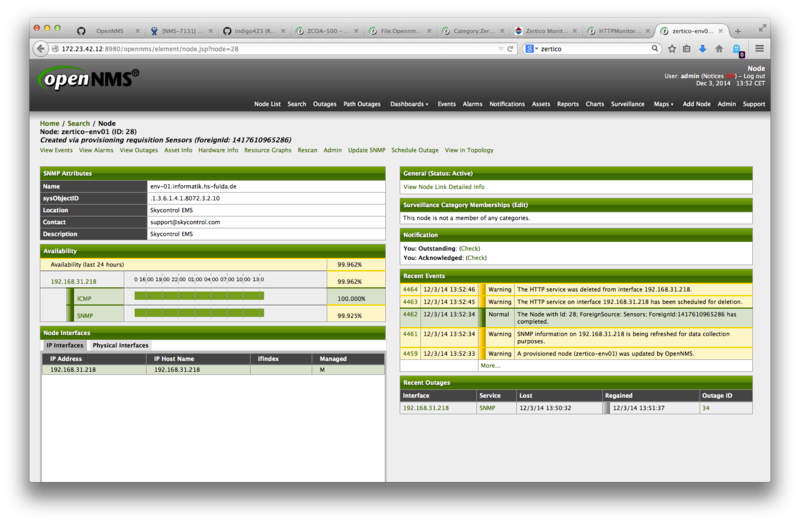
Open NMS
OpenNMS (Open Network Monitoring System) is a free, open-source program for network monitoring and enterprise network management. It is backed by a community of users and developers, as well as the OpenNMS Group, which offers commercial services, training, support and custom development. The challenge for the OpenNMS community is to create a truly distributed and scalable application performance management platform for all aspects of the FCAPS model, while keeping the program completely free and open source. The current development focus is on fault and efficiency management, so the current functional areas of OpenNMS include Event Management and Notifications, Discovery and Provisioning, Service Monitoring, and Data Collection.
OpenNMS provides a comprehensive fault, performance and traffic monitoring solution that integrates with business applications and workflows to monitor and visualize everything in a network. The platform monitors some of the largest networks in existence, many with tens of thousands of networked devices, in the healthcare, technology, finance, government, education, retail and industrial sectors. According to OpenNMS Group, customers include 3 of the top 5 companies on the Fortune 100, as well as multiple large and multi-state health providers and one of the largest electronic medical record providers in the United States.
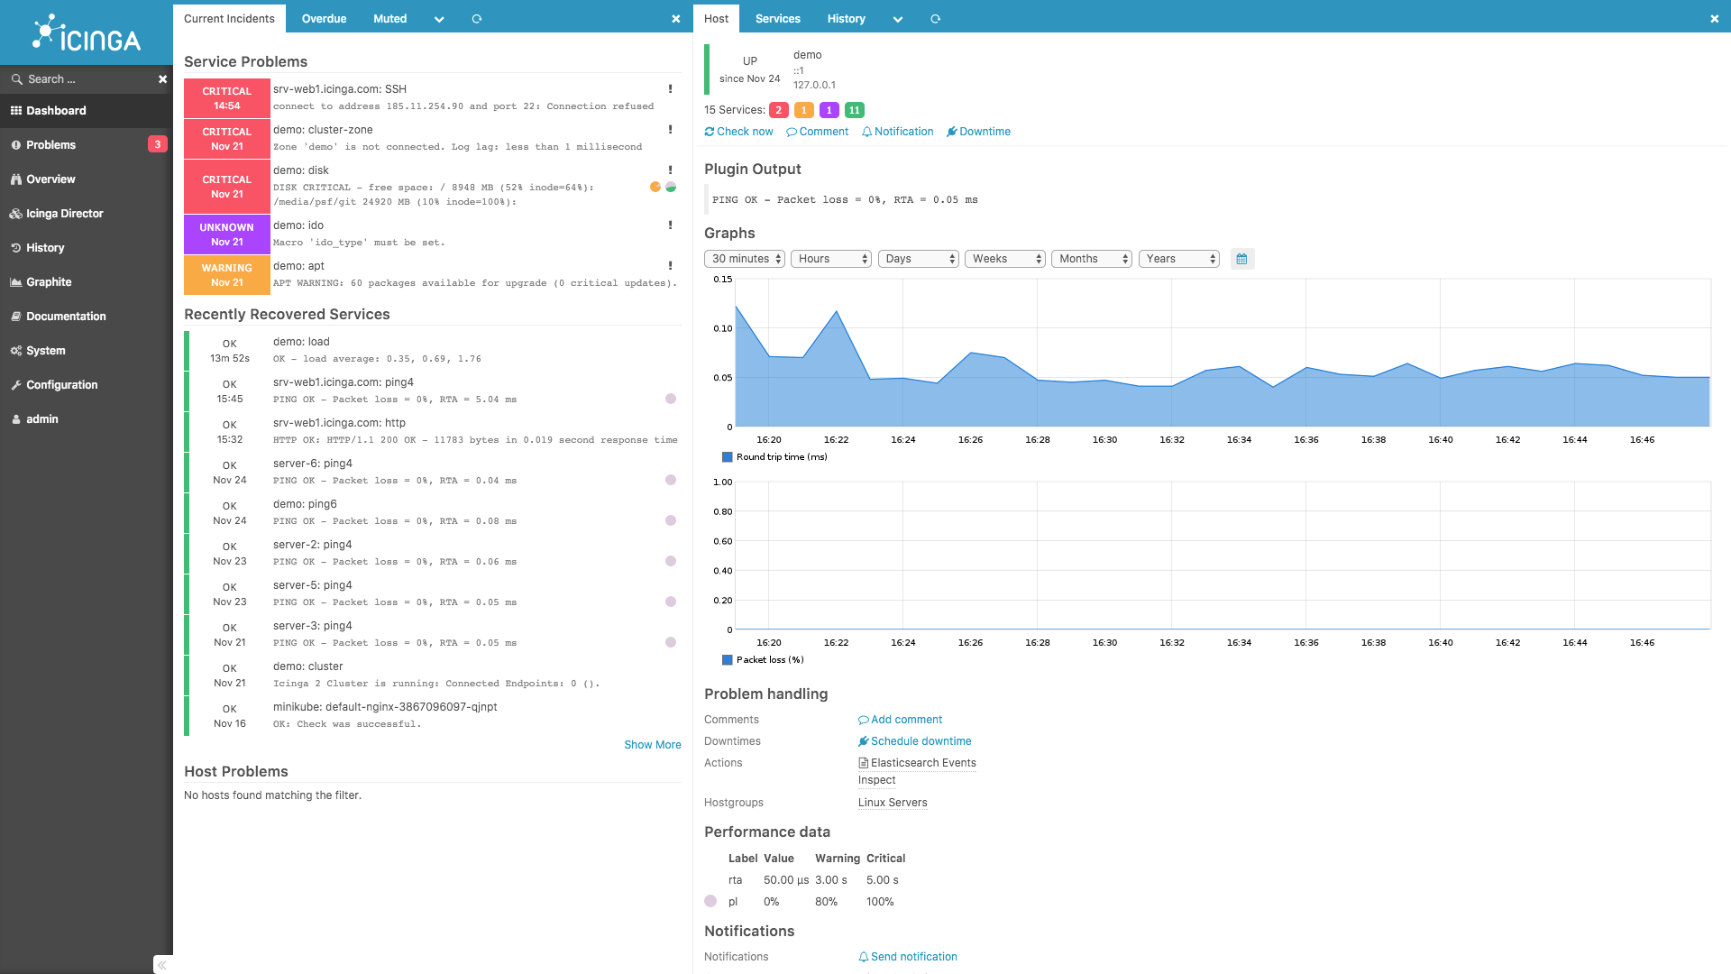
Icinga
Icinga is an open-source computer system and network monitoring application. Since it was originally created as a fork of the Nagios system monitoring application, it fills a very similar niche. Icinga has acquired a huge fan base amongst monitoring audiences, and it has features that you might expect to see only in a costly business solution. Icinga offers a free, open and complete solution for most operation monitoring — in particular, Icinga is great for monitoring hosts and alerting on basic metrics. After installing the client on a server, you can monitor local CPU, memory, processes and more without the need for SNMP. Communication between client and server is TLS encrypted, adding security where typically there is none. Additionally, the process allows data to continue to be collected in the event of a communication problem, queuing the data for upload when communication is restored.
Icinga consists of several modules: Icinga Heart, Icinga CLI/UI and the Icinga Web User Interface. The user interface can be accessed in graphic or command mode. A wealth of community-developed plug-ins and community support makes it easy to customize the experience to your needs, whether you want to monitor various devices and systems, use AD or LDAP for logins, and even integrate Icinga with Nagios to get the best of both systems.
Of course, the open source nature of Icinga has its own drawbacks: Distributed configurations can be somewhat challenging to deploy, and the centralized configuration system is somewhat similar to svn or git, so understanding how this works and using it in practice can be something of a challenge for beginners.
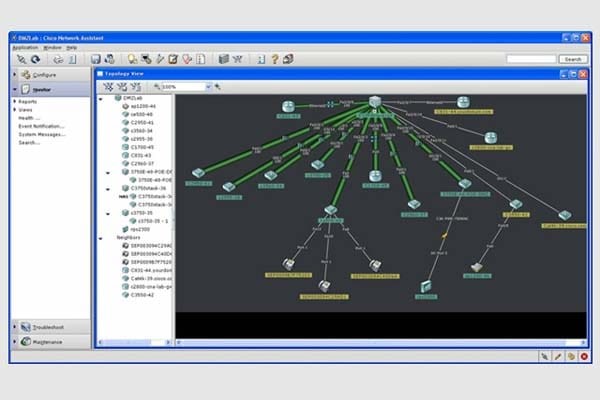
Cisco Network Assistant
Cisco Network Assistant (CNA) is free tool optimized to apply common services across Cisco switches, routers, wireless controllers and access points. The most common use for CNA is to configure your devices, as many people feel more comfortable using a GUI interface rather than the CLI. It is the perfect option for anyone operating a network that utilizes Cisco equipment, and the fact that this program is free makes it even more attractive. However, there are pitfalls: The tool can track only up to 80 network nodes simultaneously, which will be enough only for a small to medium sized businesses.
Cisco Network Assistant can find all of the routers and servers in your network and will then draw a network topology diagram. The system offers scheduled reports and warnings on situations that may affect the system. One of the most praised features of this software is the customer support — setup, troubleshooting and health monitoring of your Cisco infrastructure can be done via single interface. With a couple of clicks, you can install software upgrades, access device via Telnet or get network inventory reports. However, keep in mind that CNA is limited to Cisco devices.
![]()
![]() Jeff Melnick
Jeff Melnick
Jeff is a former Director of Global Solutions Engineering at Netwrix. He is a long-time Netwrix blogger, speaker, and presenter. In the Netwrix blog, Jeff shares lifehacks, tips and tricks that can dramatically improve your system administration experience.


![Toni Kroos là ai? [ sự thật về tiểu sử đầy đủ Toni Kroos ]](https://evbn.org/wp-content/uploads/New-Project-6635-1671934592.jpg)


