The Comparison between Consumer SSD & Enterprise SSD | Allion Labs
According to iSuppli, the price of NAND Flash would continue to drop in 2014. The price of Solid State Drive (SSD) that uses semi conductor such as NAND Flash as data storage device would gradually become friendlier which would improve consumer’s purchase intention and accelerate the speed of penetration rate. Ultrathin design of SSD is not only used on consumer products, but also massively adopted on enterprise level products. At the same time, there are some products between consumer and enterprise level.
In order to know the differences between consumer and enterprise products, Allion chooses 6 SSDs: drive Ato drive E including entry level products and high level eSSD and cSSD are from a same company, and driveF from another famous company. In this report, we would test these 6 SSDs and analyze their hardware components and performances. A further analysis would reveal the development key point of products from a same brand aiming at different target markets and would also help manufacturers know the performance of each DUT to assist them with designing new products.
Basic Information of the 6 DUTs:

In this test, we would focus on two aspects as below for further analysis:
-
Hardware Components Analysis
-
SSD Performance Footprint Analysis
Hardware Components Analysis
SSD is famous for high efficiency, low power consumption, high endurance and small size. Even SSDs from a same company, there are some differences in hardware design. For various target customers, there are some different components that may impact on SSD’s performance and stability. Allion’s senior expert team would disassemble every SSD, survey interior structure and components such as controller, PMIC, NAND Flash and poly-tantalum capacitor of each product, and give some insightful advice.
Chart 2: 6 DUTs’ Hardware Components
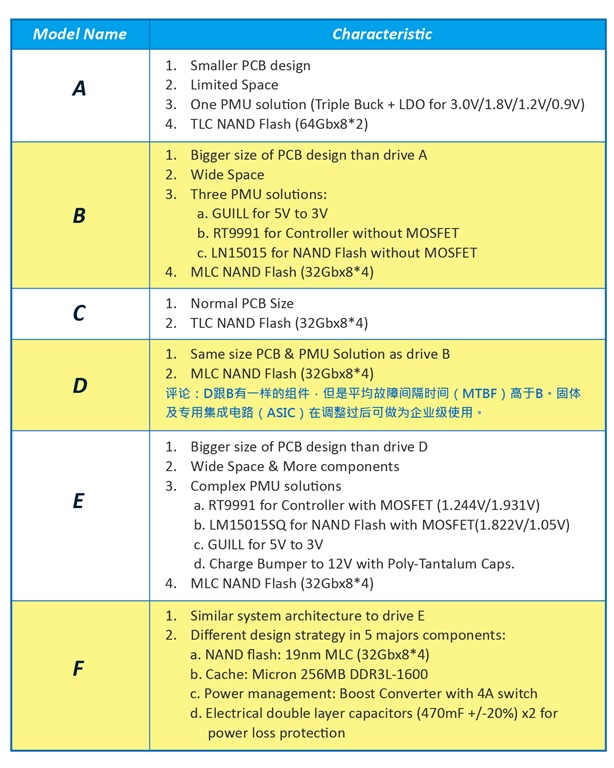
n Chart 2, it simply lists the components of the 6 drives.
SSD Performance Footprint Analysis
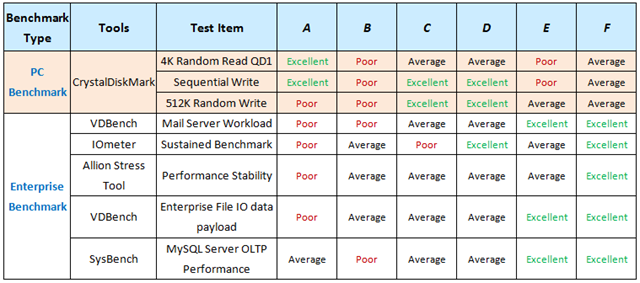
Testing tools, designed for consumer products such as CrystalDiskMark, cannot reflect enterprise products’ real performance in real using environment. In Chart 3, drive A does well under consumer testing tools but doesn’t perform well under enterprise testing tools. Drive F; on the other hand, has ordinary performance under consumer testing tools but has great performance under enterprise testing tools. Hence, Allion chooses several testing tools for enterprise drives and self-developed tool to simulate workload for enterprise servers to analyze DUTs’ overall performances of read/write endurance, stability, consistence and degradation. Here are 5 tools to analyze SSD’s performance:
-
File IO Benchmark – Server Workload
-
File IO Benchmark – Sustained Test
-
Allion Benchmark – Performance Stability Test
-
File IO Benchmark – Enterprise File IO Data Payload
-
Database Benchmark – SysBench
Chart 3: Consumer Benchmark VS. Enterprise Benchmark
-
File IO Benchmark – Server Workload
Test Tool: VDBench
Target Platform: Intel Z87、Core i7、16GB RAM
The data scale that Enterprises process is much bigger than the one that common consumers do, so we choose this test tool to simulate the enterprise server application workloads to measure the corresponding I/O for target drives.
Pic 3
Pic 4

Pic 5
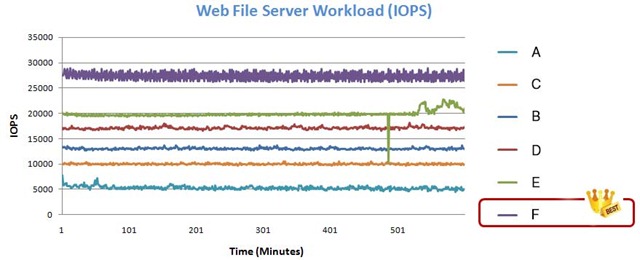
Chart 4: Test Structure of Server Workload
Server
Block Size in Bytes
Read/Write Percentage
Random/Sequential
Percentage
Mail Server
4KB
67% / 33%
100% / 0%
Media Streaming Server
64KB
98% / 2%
0% / 100%
Web File Server
4KB, 8KB, 64KB
95% / 5%
75% / 25%
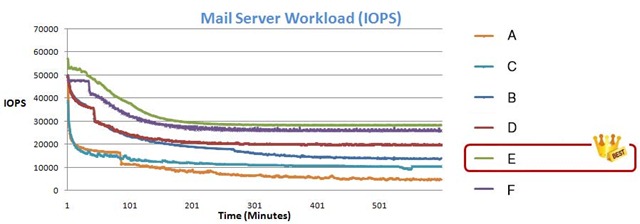
In Server Workload Test, drive E has the best performance under “Mail Server Workload” with the highest IOPS. Drive F has the best performance under “Media Streaming Workload” and “Web File Server Workload”. Especially under Web File Server Workload, drive F is far ahead of all other drives. From the three pictures above, we can see that drive C is ranked the second-last and its rank is even lower than the consumer product drive B, indicating that enterprise entry-level eSSD is not always better than consumer products.
-
File IO Benchmark – Sustained Test
Test Tool: IOmeter
Target Platform: Intel Z87、Core i7、16GB RAM
According to JEDEC, the 4K block size is most frequent-used data payload for enterprise SSDs. This sustained test adopts IOmeter to generate QD 32 Random Write workload for target drives. All DUTs would be tested for consecutive 24 hours.
Pic 6
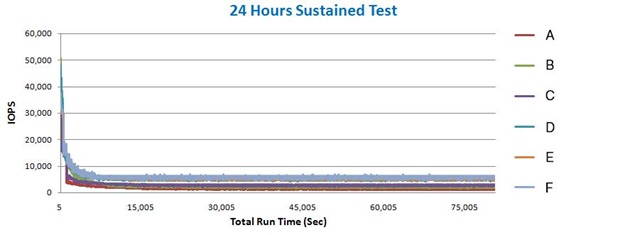
In Pic 6, every drive maintains very high IOPS in the beginning of 24 Hours Sustained Test and drops to low stable states for the rest 22 hours.
Pic 7
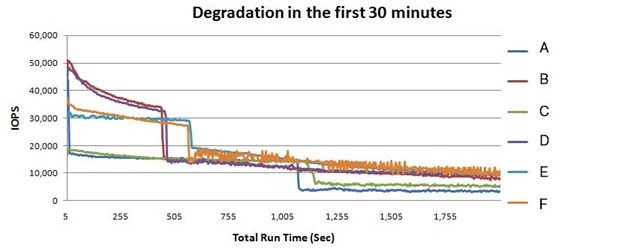
This graphic above shows the degradation situation for all drives in the first 30 minutes. We can find out that drive A and drive C drop faster and lower. Besides, drive F has less degradation under long-term random write pressure test, showing that it serves as a reliable and stable product for enterprise environment.
-
Allion Benchmark – Performance Stability Test
Test Tool: Allion stress tool
Target Platform: Intel DZ68DB system
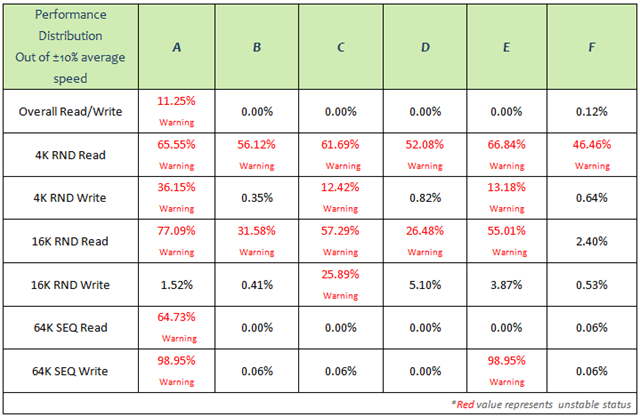
Poor wear leveling and harsh workload condition may cause performance inconsistency and fluctuation over a certain period of time. With the abundant experiences in the field of SSD certification technique, Allion especially develops test tool for enterprise products. Our customized Performance Stability Test, which consists of total 10TB real data workload including file types such as video (e.g., 3DP, AVI), audio (e.g., MP3, WAV), picture (e.g., BMP, JPG) and others (e.g., BAT, DLL, ZIP) can diagnose the performance inconsistencies that target drives may encounter and scrutinize DUT’s performance under 4K Random/Sequential Write/Read, 16K Random Write/Read and 64K Sequential Write/Read.
We set the plus and minus 10% of the average value of every DUT’s own raw data as standard range for performance stability criteria. If a DUT has more than 95% Read/Write performance data out of its own standard range, it would be warned as an unstable drive. Chart 5 shows that drive F has the best stability performance, although it is a little unstable on 4K Random Write test item. Drive A has the worst performance. Besides, even though drive E’s price is more expensive than drive D’s, drive E doesn’t have relatively stable performance, because it has stability issue on big data read/write.
Chart 5: Comparison of Performance Stability Test I.
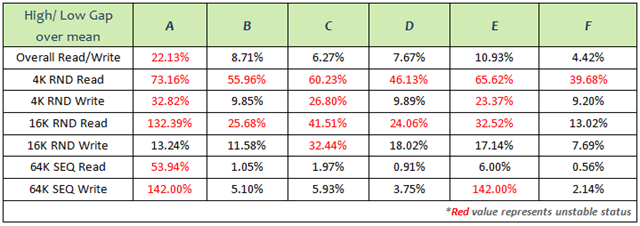
Generally, that top 10% performance average and bottom 10% average gap over overall mean should be less than 20% of mean. It not, then this drive has potential risk. In Chart 6, drive F only has high level disparity performance behavior in 4K Random Read test item but has the overall best stability performance which lives up to enterprise’s demand. On the other hands, drive A and drive E have high level disparity performance behaviors during 10TB data access. The technology of SDD has come a long way, but manufacturers still have a lot to do on maintaining the stability of products.
Chart 6: Comparison of Performance Stability Test II.
-
File IO Benchmark – Enterprise File IO Data Payload
Test Tool: VDBench
Target Platform: Gigabyte GA-Z77-D3H
To evaluate all DUTs on long stress environment with different conditions, VDBench will be used to simulate DUT’s performance when processing 0.5K, 4K, 16K and 64K files. The workload is based on JEDEC’s definition: 40% Random Read and 60% Random Write. All DUTs would be tested for 50 hours and would be evaluated according to their IOPS. In Pic 8, drive F has an IOPS average of more than 100, outshining all other DUTs.
Pic 8
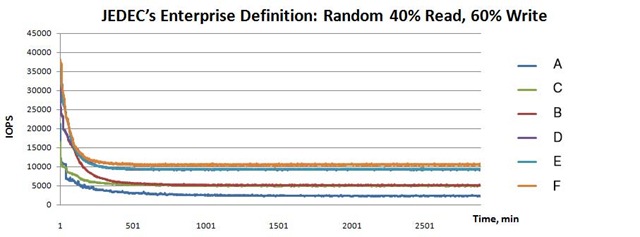
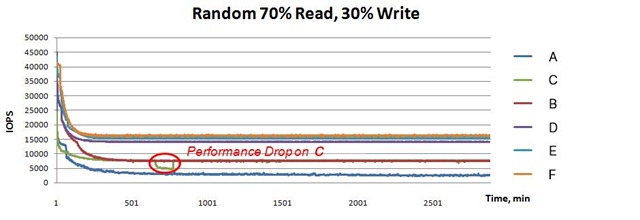
If we switch Random Read to 70% and Random Write to 30%, drive F’s IOPS still remains the highest which indicates that drive F has high-level capability of maintaining high efficiency no matter processing Random Read or Write. In Pic 9, drive C’s performance drops in the 8th to 16th hour.
Pic 9
-
Database Benchmark – SysBench MySQL
Test Tool: SysBench MySQL
Target Platform: Dell T620 Xeon*2, 64GB RAM
MySQL has been used for test tool for many years since its biggest advantages are high efficiency and high reliability. We use this tool to simulate a middle-size enterprise (nearly 200 users) database environment for target drives and generate the MySQL workload for performance evaluation. There would be 40 Tables with 10,000,000 rows each (106 GB of data) working at the same time. We would evaluate the performance of DUTs under different buffer pool size settings and multiple threads.
When OLTP throughput’s buffer pool size is lower than 15GB and thread is 64, as in Pic 10, drive F’s average OLTP throughput is 2820.63, which is the best DUT. In Pic 10, each dot in the graphic indicates each throughput during testing; the more dispersed the situation is means the more performance inconsistence issues happen. For example, drive A and drive C have this problem. To sum up, drive F not only wins in this test but also qualifies itself for serving the post of middle-size enterprise database.
Pic 10
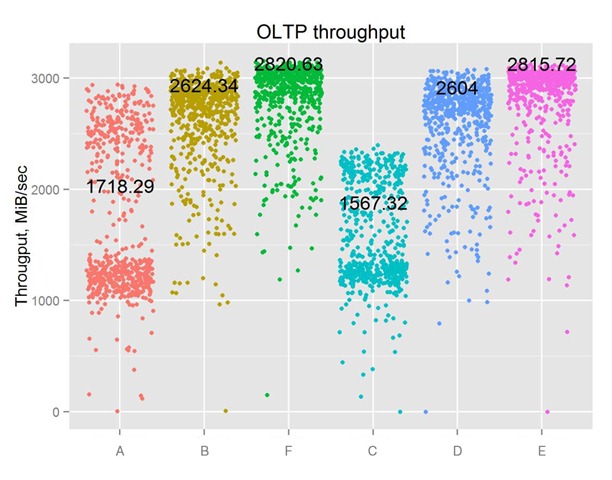
Chart 7: Competitive Analysis of All DUTs
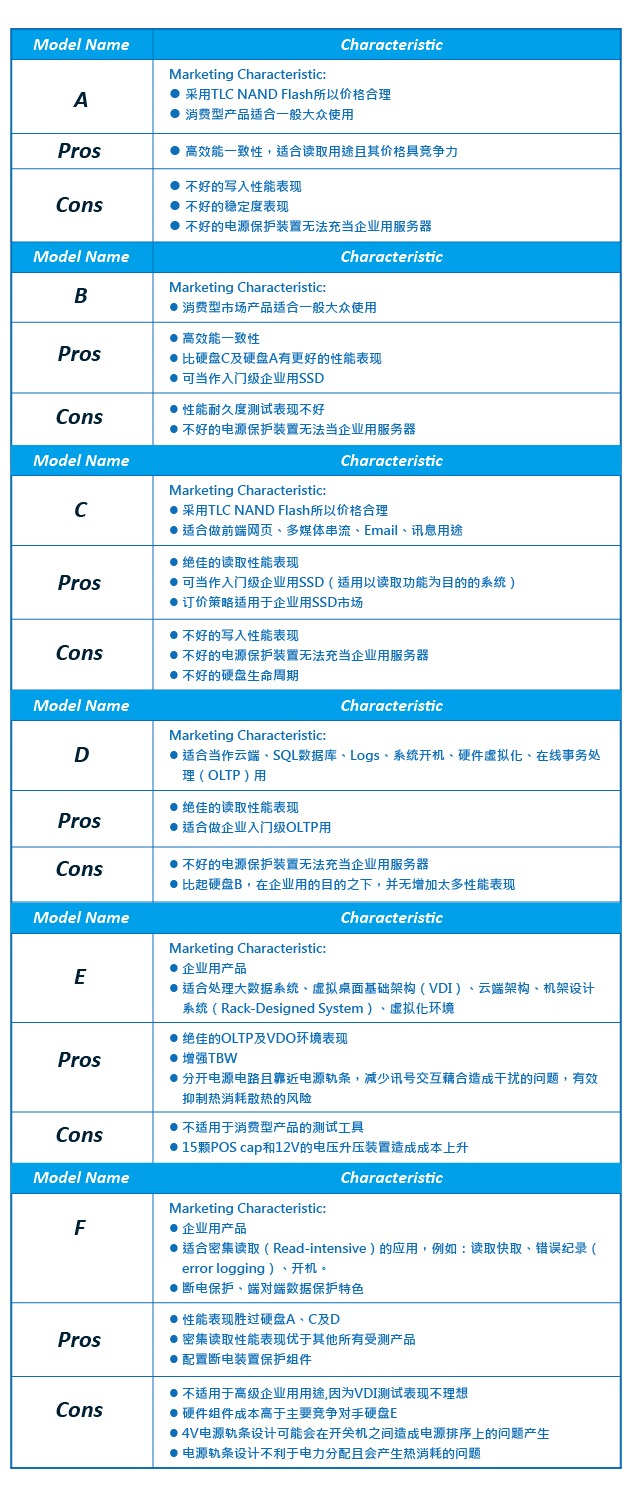
Drive F has excellent performance under most of enterprise testing; its hardware component is also designed with very high standard. However, drive F’s high price may intimidate small- and medium-sized enterprises since not all companies need SSDs with excellent performance. We also find out that from drive A to drive E, their hardware components are not that different between each other. But their price segmentation strategy makes this brand conquer the market share. Therefore, if company of drive F adopts this strategy and develop different SSDs for enterprises of different scale, it will gain more competitiveness.
We are looking forward to seeing the price of SSD becoming more acceptable to the public. It is predictable that no matter consumer or enterprise products, there will be a fierce competition. Although this test report focuses on performance degradation, endurance and stability, we would like to recommend companies to adopt multi-angle test solution to evaluate your and your competitors’ products. For more information please visit www.allion.com/strorage.html


![Toni Kroos là ai? [ sự thật về tiểu sử đầy đủ Toni Kroos ]](https://evbn.org/wp-content/uploads/New-Project-6635-1671934592.jpg)


