SolarWinds NPM – Network Performance Monitor Review – Updated 2023!
Network monitoring with SolarWinds NPM
SolarWinds is one of the world’s leading producers of IT management software. SolarWinds Network Performance Monitor (NPM) is one of its key products. This system focuses on monitoring the health of the devices connected to a network. The hardware that SolarWinds NPM keeps an eye on includes network equipment, such as routers and switches; endpoint devices, including terminals, desktop PCs, and mobile devices; and office equipment, such as printers. The constant monitoring process gathers metrics that serve troubleshooting tasks.
The NPM includes a dashboard with comprehensive controls that can help you customize your views of network data and also filter the events that are reported by the system. This is a very flexible system that is suitable for any size of network. The NPM is a standalone package.
Mục Lục
The Orion Platform
SolarWinds produces a range of infrastructure management systems and all of these, including the Network Performance Manager are written on a common platform, called Orion. All of the Orion-based software will operate in unison if bought together, thanks to a number of data interchange points and common modules.
Our methodology for selecting a network monitoring system
We reviewed the SolarWinds Network Performance Monitor software and analyzed based on the following criteria:
- An easy to use interface that includes drill-down paths plus graphs and charts
- A method to use the Simple Network Management Protocol to gather network device statuses
- Alerts to notify when a device agent spots a problem
- Alerts for approaching resource shortages
- Notifications that send out alerts by SMS and email to enable unattended monitoring
- The presence of a free trial for no-risk assessment
- Value for money represented by a comprehensive tool that performs full network monitoring
How much does SolarWinds NPM cost?
The Network Performance Monitor is sold as a fixed package. There aren’t different packages with varying sets of functions. However, the price points for the system increases with the size of the network that it will run on.
The size of the network is judged by a factor called “elements.” The elements that contribute to the count that establishes the price level of the license for the network monitoring software that you buy include the following network characteristics.
- Interfaces — these include switch ports and both physical and virtual interfaces, such as VLANs
- Nodes — this means a count of network equipment, such as switches, routers, network access points, and servers
- Volumes — this refers to the logical disks that you monitor
After you audit your network to get the number of each of these data categories, you need to take the largest of the three numbers that result from your inventory exercise. This is the number you should use when ordering the software.
MORE INFORMATION ON THE OFFICIAL SOLARWINDS SITE:
www.solarwinds.com/network-performance-monitor/
SolarWinds Network Performance Monitor
Download FREE 30-Day Trial at SolarWinds.com
The available plans are:
PlanMax number of elementsSupport and maintenancePrice $
NPM SL100 1001 year2,955
NPM SL2502501 year6,720
NPM SL5005001 year10,445
NPM SL200020001 year19,345
NPM SLXNo limit1 year32,525
All plans include the same features. The purchase of a license gives you the right to use the network monitoring software forever and its capacity will be limited to the maximum number of elements allowed with the chosen plan. If your network expands beyond the limit you paid for, you will have to upgrade your plan. The price includes one year of support and maintenance. The maintenance element gives access to the software’s updates and patches that are released during the first year of use. At the end of the first year, you have to pay an annual fee to continue the maintenance and support plan.
What are the SolarWinds NPM elements and features?
The operating procedures of the Network Performance Monitor are based on the Simple Network Monitoring Protocol. This is a network industry standard that requires an agent program installed on every device. Each device that can be connected to a network will already have an SNMP agent installed on it as part of its firmware. SNMP requires a central controller and the Network Performance Monitor provides this function.
The other main features of the SolarWinds Network Performance Monitor are:
The SNMP controller communicates with all of the agents installed on the devices on your network. You don’t have to set up the system by entering the addresses and types of all of those devices because the NPM system will use SNMP messaging to discover all of those agents. The identifiers of each device then get shown on the dashboard.
The Homepage of the dashboard gives you aggregated data, but you also get lists of devices with the facility to drill down and examine the current condition of that node. Network membership gets updated regularly, so if you add, remove, rename, or move a device, those changes get reflected in the NPM data without any manual intervention.
The main task of the SolarWinds NPM is to poll SNMP agents to gather information on the statuses of all of the devices that they sponsor. This data collection and collation function is the main purpose of the Network Performance Monitor. Information is easily accessible through a dashboard, which integrates graphics elements and color coding to highlight the status of the network’s equipment.
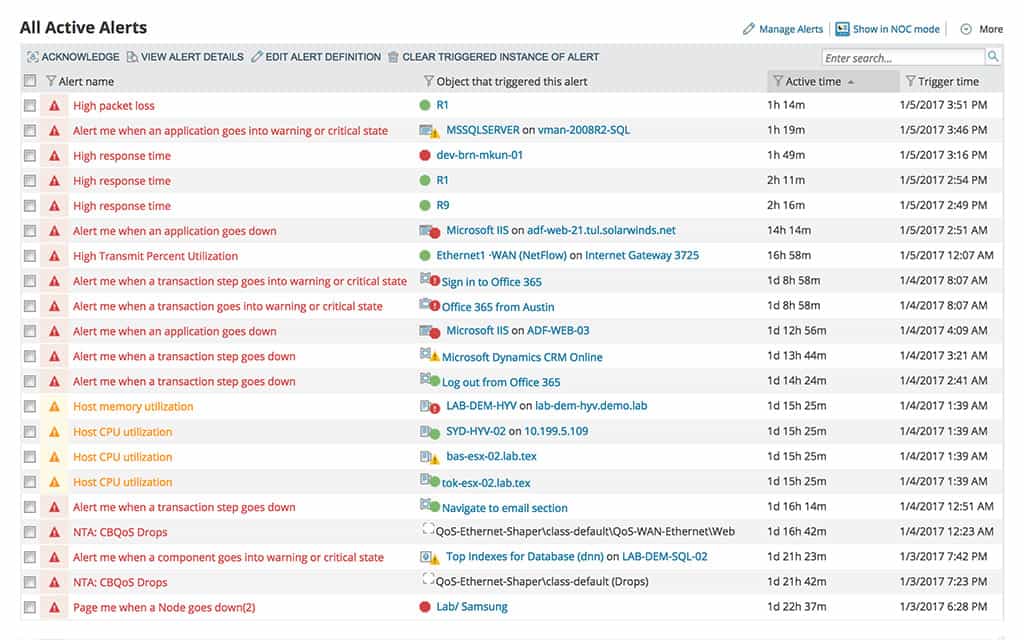
NPM Devices ActiveThe data structure of SNMP is difficult to decipher. However, regular messages sent from the SNMP agents contain a large amount of potentially cogent data. The monitor sifts through all of the metrics reported by the agents and interprets them into meaningful information. You can even choose to ignore some devices and prioritize others.
Setting alert conditions
A key capability of SNMP agents is their ability to override their passive reporting mode and send out a “trap” message when status changes occur between information requests from the controller. The Network Performance Monitor displays these alerts immediately in the dashboard. Overall network statuses can be set as customized alerts. It is easy to set policy limits to create warnings that don’t just report SNMP trap sessions. This capability also enables you to filter out non-critical or mundane status change alerts to prevent your identification of genuinely critical failures from being crowded out by maintenance messages such as printer low toner warnings.
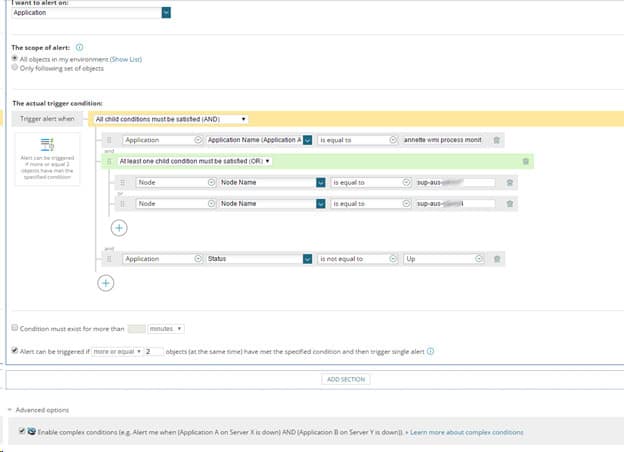
The treatment of warnings can be filtered and staged so that non-critical alerts can go to log files. However, that doesn’t mean that relatively minor warnings are overlooked because you can specify a combination of conditions that would accumulate into a serious problem. The dashboard gives you the option of launching external programs when certain alerts conditions arise. You can also nominate email accounts that should be notified of given alerts, and those notifications can also be sent by SMS. These capabilities enable you to automate some responses and also direct information to those responsible for specific devices. So, if you have a service agreement with an outside party, you can get an equipment failure notice sent straight to that company’s Help Desk, saving you the time of putting through calls and waiting in a queue.
Performance analysis
Information on potential failures before they happen is probably the kind of service you are looking for in a network monitor package. However, the SolarWinds Network Performance Monitor goes one step further in supporting troubleshooting and your effort to prevent system outages. Some network tools can help you identify a particular source of potentially important information, but not others. Getting data together from different network nodes for analysis can be complicated. Often you have to resort to importing data into a spreadsheet to try to get a clearer picture of status impact and knock-on damage.
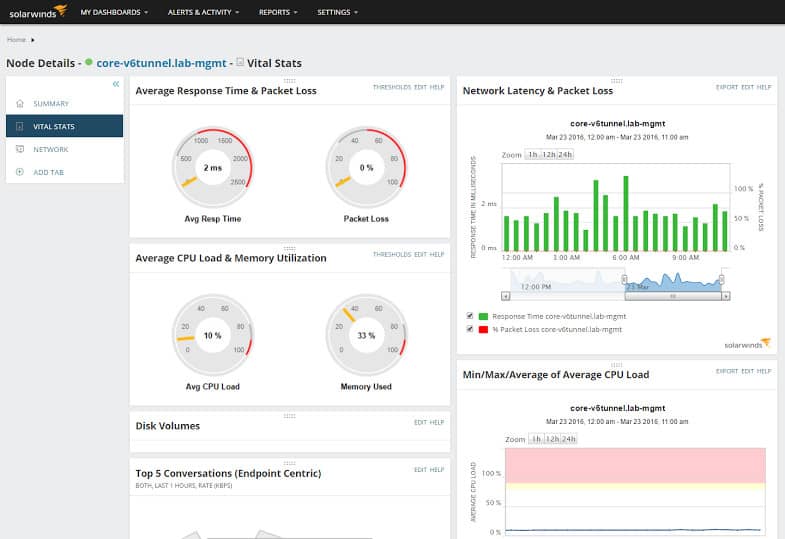
The performance analysis features of the Network Performance Monitor enable you to gather data from different nodes and see different types of data side by side. A drag and drop function lets you assemble performance reports to see them side by side, observing either live or historical data. The graphical display widgets of charts make performance impact easy to trace when you align your target data sources on a common timeline. The results of your analysis can be fed back into the monitor because you will be able to refine your status alerts policies once you have better performance information gleaned from your analysis.
Reporting and data sharing
The analysis and data visualization functions of the SolarWinds NPM dashboard are great tools for identifying performance issues. The reporting facilities of the system enable you to take snapshots of live data, aggregate sources and display analysis of historical data.
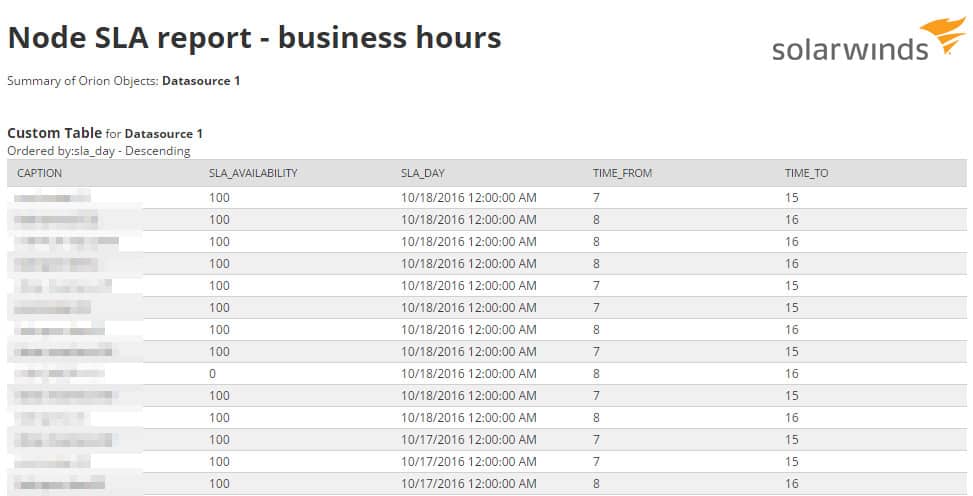
This output can be delivered in a distributable format enabling you to illustrate goal achievements, report on team performance, and check on SLA targets. A module called PerfStack generates a URL of your assembled data views, which you can email out to stakeholders to promote discussion and collaboration.
Multi-vendor support
The likelihood is that your network equipment was manufactured by several different suppliers. The universality of the SNMP structure used by the Network Performance Monitor overcomes the problem of software incompatibility.
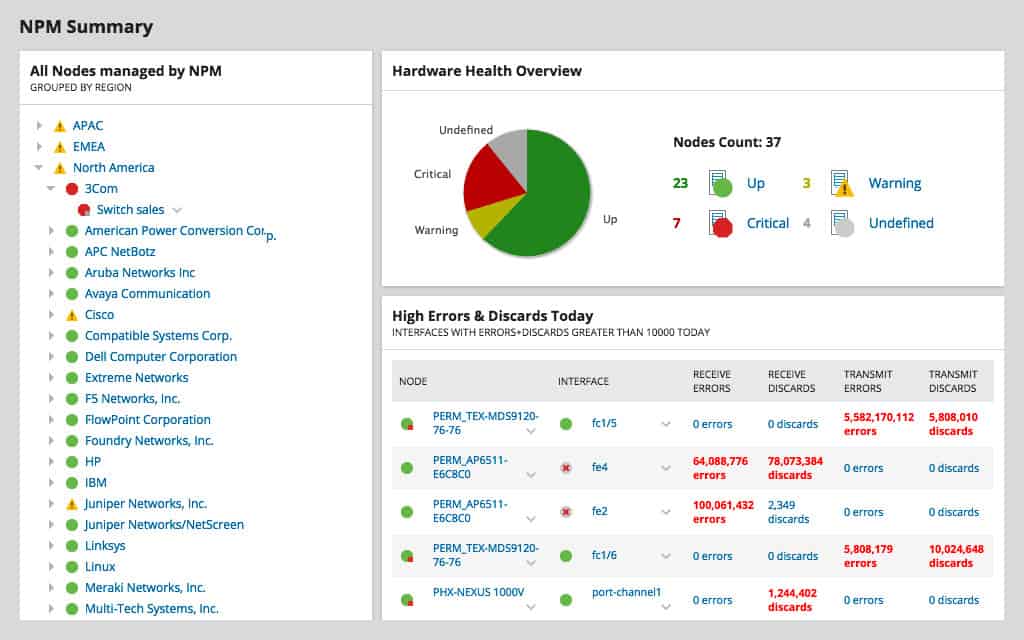
Although the monitoring software and dashboard can only be installed on Windows, the operating system or firmware type of the devices that you want to monitor would not be a consideration. The monitor can communicate with SNMP agents no matter what underlying operating system supports your devices.
Wireless polling
SolarWinds NPM is not limited to monitoring LANs. The system extends its capabilities to wireless networks and hybrid systems, too. The monitor is able to check on signal strength and it can detect dead zones. The dashboard includes a great visualization that shows the signal footprint of your wifi equipment. This information will enable you to plan the physical location of routers and repeaters.
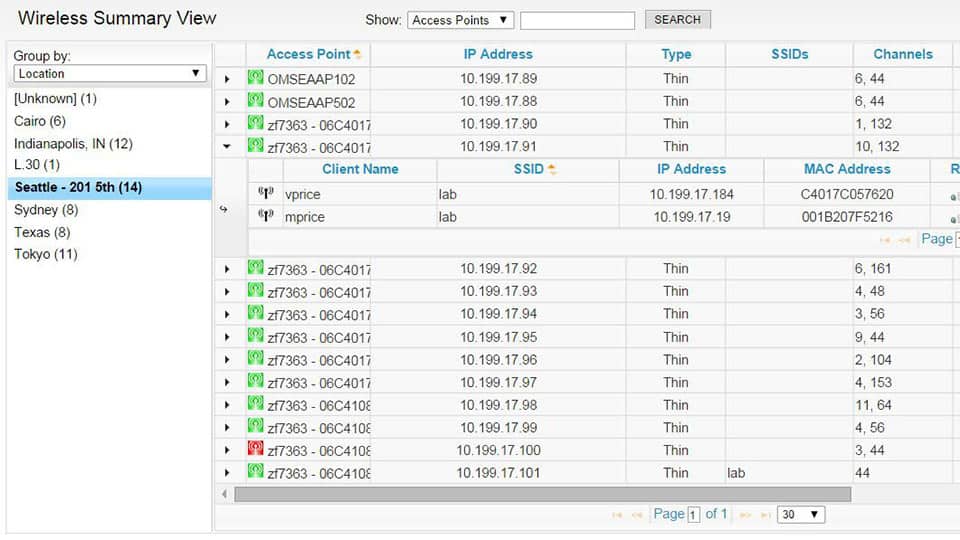
The wireless features of the Network Performance Monitor are a real bonus because it can detect rogue devices on the network. This is an important network security function that will make it easier to allow staff to use their own devices at work. The BYOD environment requires the application of diverse policies to account for different device types and user group access. The SolarWinds NPM includes these capabilities.
Virtual environment monitoring
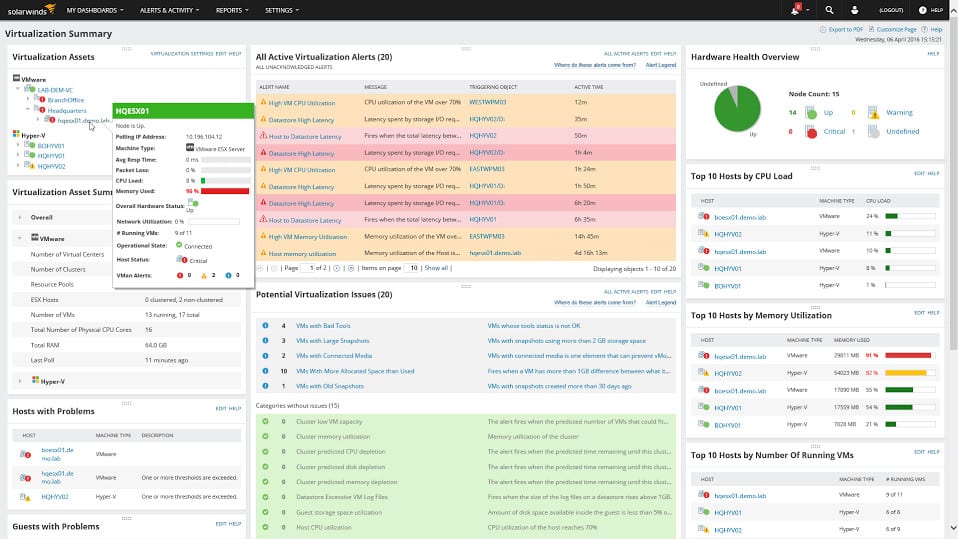
If you run virtualizations, that will be included in the Network Performance Monitor’s coverage. A section in the dashboard is dedicated to virtual environments and it will even extend out to cloud services and include them in the network discovery process.
The NetPath Network Path Analysis feature of SolarWinds NPM gives you a visual representation of your network topology. You don’t have to set this layout up on the dashboard because it is assembled automatically during the network discovery phase. The network map shows you traffic volumes per link and across entire paths. The network map includes virtual environments and even follows data flows over the internet to show access routes to cloud services. This is because NetPath includes a Traceroute element to aid in troubleshooting traffic delays.
Traffic flows can be monitored by the user, application, protocol, or device. Network maps will help you isolate bottlenecks and failures in your network. With this information, you can better allocate resolution tasks to team member specialists and service providers.
SolarWinds Network Performance Monitor system requirements
Remember that the SolarWinds NPM software can only be installed on Windows. The package creates two services, which are an application server and a database server. These two parts cannot be installed on the same machine. The hardware requirements for the system increase with the higher levels of element monitoring capabilities. That is, you need a more powerful computer to run NPM SL2000 than you need to run NPM SL100.
You need Windows Server 2012 or Windows Server 2016 for both elements of the system. Your database environment needs to be based on Microsoft SQL Server 2012, 2014, or 2016.
The computer that you want to run the monitor on needs at least a Quad Core Processor with a 2.5 GHz clock speed. That speed needs to be at least 3 GHz for the SLX edition. The computer that hosts the database also should have a Quad Core Processor but needs a speed of at least 3 GHz even for NPM SL100.
The memory that you need for the monitor software hosting computer and the host for the database is shown below for each version of the Network Performance Monitor.
PlanApplication server RAMDatabase server RAM
NPM SL100 6-8 GB8 GB
NPM SL2506-8 GB8 GB
NPM SL5008-10 GB10 GB
NPM SL200010-16 GB10-64 GB
NPM SLX18-32 GB64-128 GB
In all cases, you need two 146 GB 15K hard drives. Your network card needs to be at least 1 GbE.
How to install SolarWinds Network Performance Monitor
The installation process is guided by an installer wizard. Before you begin the installation process, check that the host you intend to use meets the system requirements.
To access the free trial. Go to NMP trial page of the SolarWinds website at https://www.solarwinds.com/network-performance-monitor/registration
SolarWinds NPM
Download 30-day FREE Trial
Fill out the registration form and click on the Proceed to Download button. This is where you can find the installer download.
If you are already a SolarWinds customer, go to the Customer Portal and log in. Look at Latest Downloads for You Products and click on the Network Performance Monitor. Click on Choose.
Follow these instructions:
- Click Download to download either the online or offline installer. Choose the Online option if your server is connected to the internet. Use Offline if you intend to move the downloader onto a different computer that isn’t connected to the internet.
- Save the installer file
- Run the installer .exe file on your server as Administrator. The installer shows a Welcome page.
- Select the type of installation with the options being Lightweight Installation, Standard Installation, and Add a scalability engine. Choose Standard Installation.
- Set the Destination Folder.
- Click Next. You will arrive at the Select Products page.
- Select the Network Performance Monitor to install
- Nominate your language
- Click Next. You will get to the Install Report page. This shows the System Check Results
- Ensure that there aren’t any points marked Critical Issue in the report. Informational and warning messages are not showstoppers.
- If there is a critical issue, click on the details link in that line of the report. After resolving the problem, click on Run Checks Again.
- Click Next.
- Review the agreement and Terms of Use (EULA). Click on Next.
- Watch the installation progress. A reboot might be required during the installation process.
- On the Completing the Orion Configuration Wizard page, click Next.
- When the configuration is complete, click Finish to launch the Orion Web Console.
Log in to the console with user name admin. Enter a password for the admin account, confirm the password, and then click Save & Login.
Summary
Although you may be tempted to try out the Network Performance Monitor for a small network, its functionality is better suited to medium to large systems. Its extra functions and visualizations will really boost administration productivity and network stability for large and complicated networks.
There are some very nice extra features with the SolarWinds Network Performance Monitor, which you wouldn’t normally expect from this category of network monitoring software. These include the capability to set customized alert conditions from combined network data sources, so you aren’t just recording the statuses of individual devices. The NetPath module is another nice utility that extends the troubleshooting capabilities of the Network Performance Monitor out into bandwidth analyzer territory. The ability to monitor virtual environments, wireless networks, and internet routes adds to the LAN monitoring functions to create a truly global monitoring service that would work very well for hybrid and complex network topologies.
Probably the most difficult part of the order process is working out how many elements your network entails. However, you can get the system to work that number out for you because SolarWinds offers a 30-day free trial of Network Performance Monitor and a menu item in the dashboard gives you an element count.
The Network Performance Monitor really is the top-of-the-line network manager package. Undeniably, all of those great features come at a price, which is why you really need to take the software for a spin on the free trial before you commit to a purchase.
If you discover that you really couldn’t live without all of the facilities of this package as the end of the trial approaches, then the expense is completely justified. If you don’t really use many of the extra features of Network Performance Monitor during the free trial, then maybe you could manage your network with a much smaller system. Either way, the free trial will form an essential step in your decision-making process.
SolarWinds NPM
Download 30-Day FREE Trial
SolarWinds Network Performance Monitor FAQs
What is SolarWinds?
SolarWinds is a producer of system monitoring and management tools. Based in Austin, Texas, the company is the world’s leading vendor of network management tools and the third-largest provider of system management software.
How do I start SolarWinds NPM?
In order to start all Network Performance Monitor services, go to the Start menu on your server and select Orion Service Manager. Once the Orion Service Manager opens, click on the Start Everything button at the top of the screen. This ensures that all of the services for the NPM start as well as the NPM console.
Is SolarWinds network performance monitor Free?
SolarWinds charges for its Network Performance Monitor. However, you can access the package on a 30-day free trial.


![Toni Kroos là ai? [ sự thật về tiểu sử đầy đủ Toni Kroos ]](https://evbn.org/wp-content/uploads/New-Project-6635-1671934592.jpg)


