
Solarwinds Network Performance Monitor (NPM) Review & How-To Guide
In this article, we will review the SolarWinds Network Performance Monitor (NPM) which is one of the major network monitoring tools available on the market.
We will also set up a lab environment to install and configure SolarWinds NPM to monitor some devices.
SolarWinds NPM has several features including network discovery, availability monitoring (e.g. node is up/down), health status (e.g. CPU usage), performance monitoring (e.g. interface bandwidth utilization) and so on.
There are other SolarWinds products that complement NPM including the Network Configuration Manager (NCM) and NetFlow Traffic Analyzer (NTA) but we will restrict our discussion to the NPM in this article.
Mục Lục
Lab Setup
To make this article as practical as possible, we will install SolarWinds NPM to monitor a Windows Server 2012 and two Cisco routers in a lab environment.
The lab setup is as shown below:

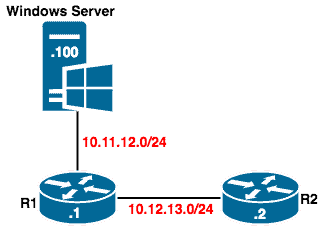
For this evaluation, I launched an AWS EC2 instance on which the SolarWinds NPM will be installed.
I’m using Windows Server 2012 R2 as my base OS even though Windows Server 2012 and Windows Server 2016 are also supported by SolarWinds NPM.
For the networking side of things, I’m using GNS3 to simulate my routers.
To create a network between the Windows Server and the GNS3 lab, I created a loopback interface on the Windows Server and then connected one of the routers to this loop-back interface.


Hint: Adding a loop-back interface to newer Windows operating systems is very simple. Just search for “Loopback Manager” and follow the instructions on the command prompt window that opens.
For older versions of Windows, this article will help.
The configuration on the routers is simple: IP addresses, EIGRP and SNMP community strings. The configuration on R1 is as follows:
hostname R1

!

ip domain name example.com

username cisco privilege 15 secret cisco123

!

interface Loopback0

ip address 1.1.1.1 255.255.255.255

!

interface FastEthernet0/0

ip address 10.11.12.1 255.255.255.0

no shutdown

!

interface FastEthernet0/1

ip address 10.12.13.1 255.255.255.0

no shutdown

!

router eigrp 10

network 0.0.0.0

no auto-summary

!

snmp-server community cisco123 RO

!

line vty 0 4

login local

!
The configuration on R2 is as follows:
hostname R2

!

username cisco privilege 15 secret cisco123

!

interface Loopback0

ip address 2.2.2.2 255.255.255.255

!

interface FastEthernet0/0

ip address 10.12.13.2 255.255.255.0

no shutdown

!

router eigrp 10

network 0.0.0.0

no auto-summary

!

snmp-server community cisco123 RO

!

line vty 0 4

login local

!
Note: To make R2 reachable from the Windows Server, you can add a static route through the command prompt.
Just run command prompt as administrator and use the command:
route add 10.12.13.0 mask 255.255.255.0 10.11.12.1
Just to confirm that the Windows Server can reach both routers, I will ping:

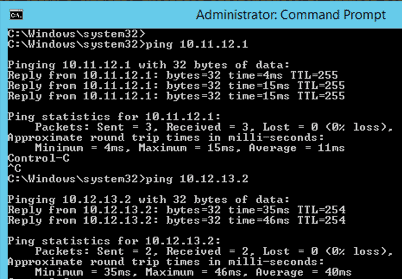
Cool!
SolarWinds NPM Installation
Having set up our lab, we will now get into the nitty-gritty of setting up SolarWinds NPM.
In this section, we will discuss the installation of NPM, Network Discovery, Alerts, Reports and so on.
Pre-Installation & System Requirements
SolarWinds NPM is a beast and everything about it is in beast mode, from the file size to the system requirements.
The offline installer for SolarWinds NPM is over 2GB (even though they have a smaller online installer file that is less than 50MB).
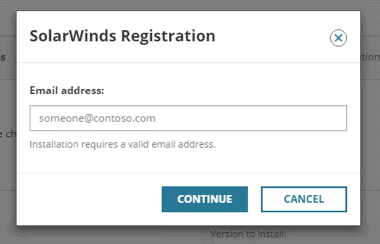
You can get the download link after registering for a 30-day free trial.
![]()
![]()
After registering, the installation file that requires an Internet connection will start being downloaded automatically. On the right of the screen, you will see the option to download the offline version, which is the one I used.


The system requirements for SolarWinds NPM are also quite high especially with the latest version (as of this writing – version 12.2). You can view the requirements here but in summary, you need at least:
- Quad-Core Processor CPU
- 6GB of RAM
- 20GB of hard disk space
Evidently, SolarWinds means business and expect its product to be installed on production servers. If you will be installing for production use, you will probably also want to install a separate database server which has its own set of requirements.
For evaluation purposes, you still have to meet the hardware requirements but you can install on a Windows desktop operating system like Windows 8.1 or 10.
To meet these requirements, I used the t2.xlarge EC2 instance type on AWS which gives me 4 vCPUs and 16GB of RAM. I also used a hard disk space of 50GB.
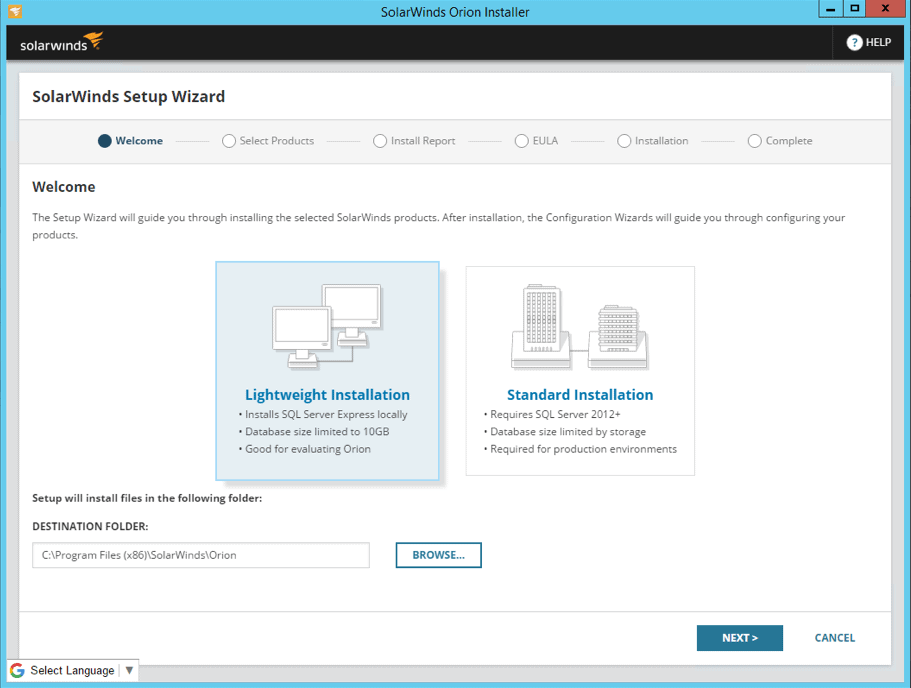
Installation
The installation of SolarWinds NPM is pretty straightforward. You can choose between the Lightweight installation and Standard installation.
The lightweight installation is good for evaluating SolarWinds NPM and installs SQL Server Express on the same server.
On the other hand, the standard installation is meant for production environments and requires a separate SQL Server 2012+.
For this article, we will be using the lightweight installation.

SolarWinds seems to like collecting email addresses a lot and you will be required to enter an email address before installation.

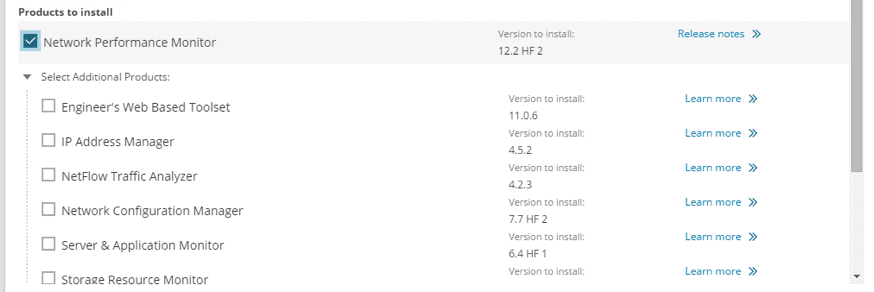
One cool thing is that you can select additional SolarWinds products to be installed along with NPM. For this article, we will stick to only NPM.

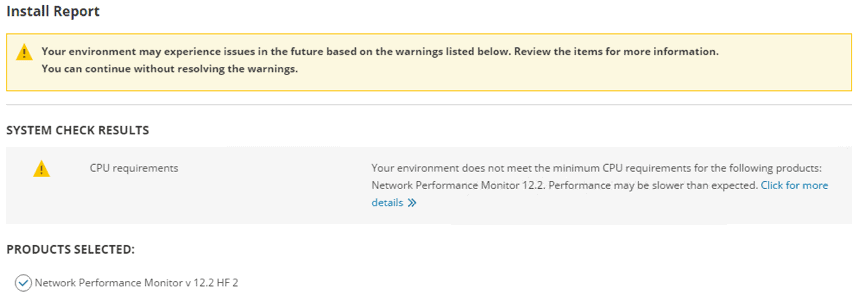
Next, the installation will run checks to make sure that the server on which NPM will be installed meets the requirements.
As you will see in my case, even my 4 vCPUs is not enough. However, for evaluation purposes, I will be fine.

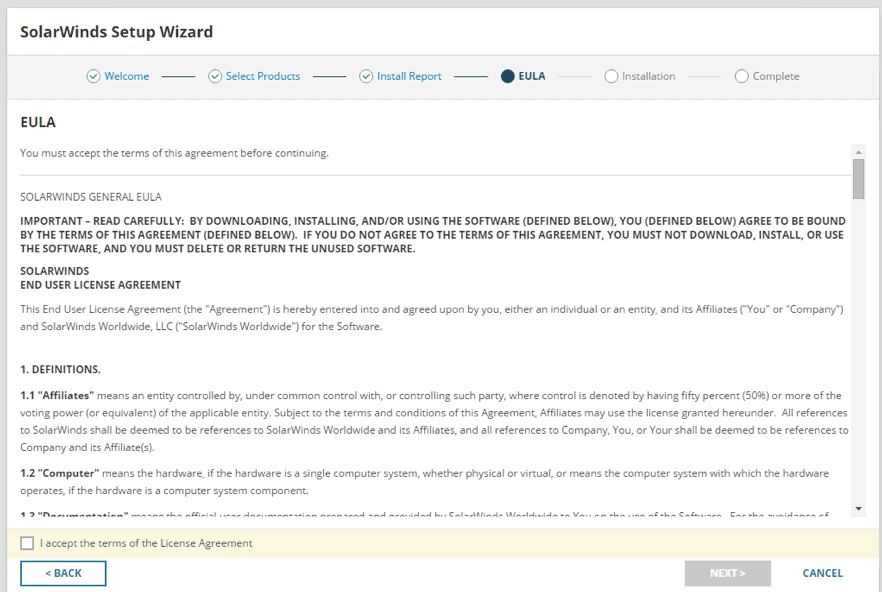
Assuming your system meets the requirements, you will need to Accept an end user license agreement before the installation begins.

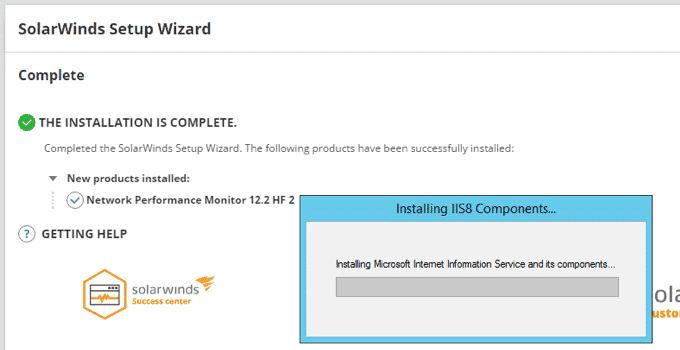
Once SolarWinds NPM has been installed, it will install other required components like Microsoft IIS.
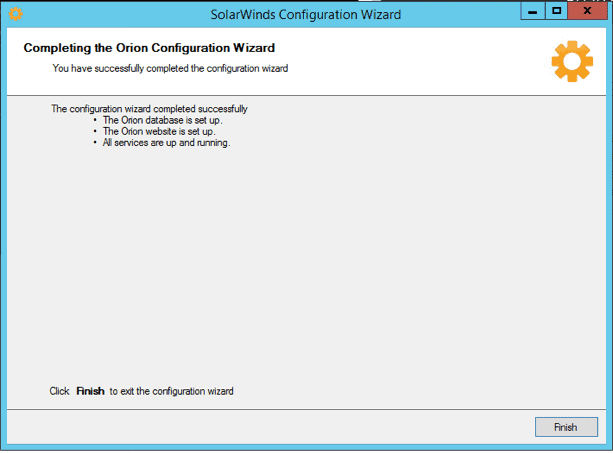
All things considered, the installation took about 15 minutes to complete.

At the end of the installation when you click on this Finish button, the Orion web console will automatically open in your default browser.
The default port used for the web console (with evaluation installation) is 8787.
If you go through the standard installation, you will have the option to choose the web console port, probably port 80.


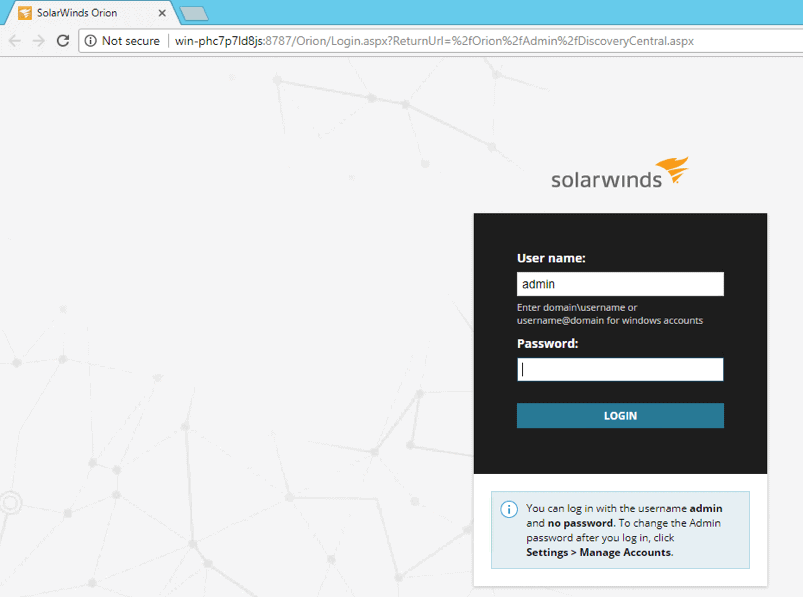
The default username is “admin” with a blank password; so you can just click on LOGIN.
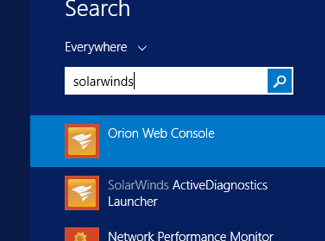
Note: You can also open the Orion Web Console like any normal application – search for it from your Windows search bar and click on it to open.

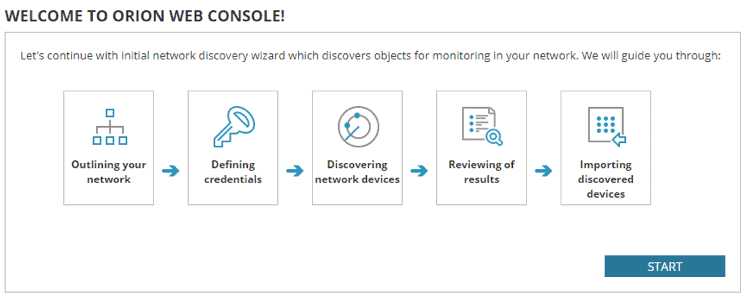
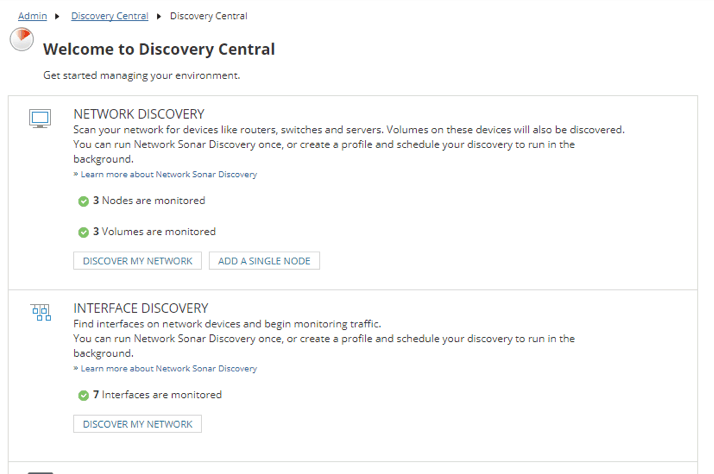
Opening the web console for the first time, you are presented with the Discovery Central page which allows you to either automatically discover a network or manually add a single node.

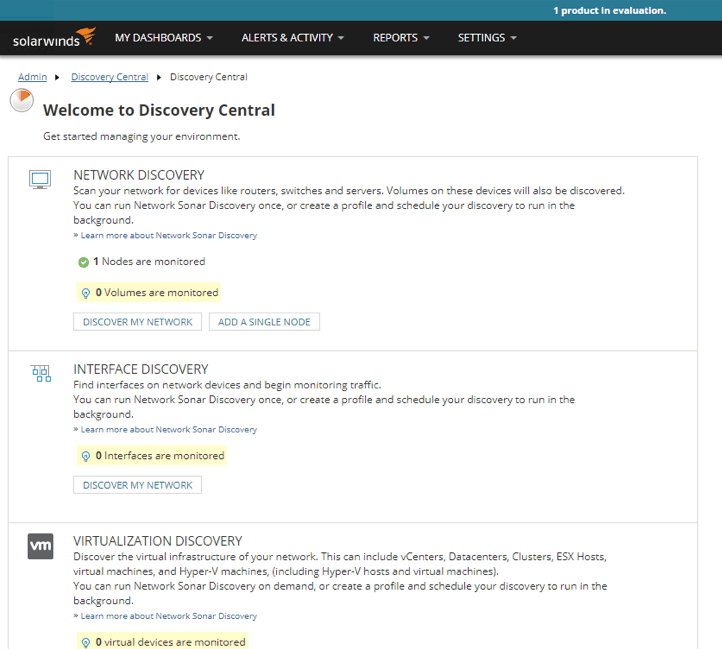
In our case, you will notice that there is already a node being monitored.
This is the local server on which SolarWinds NPM is installed – you don’t have to do anything extra to monitor the local server.
Before running any network discovery, let’s take a look at what kind of monitoring information SolarWinds NPM gives about the local server.
At the top of the page, click on MY DASHBOARDS and then select Summary under HOME.

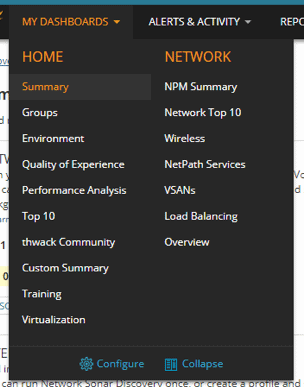
Note: If you install more SolarWinds products, the MY DASHBOARD menu will include more subsections than HOME and NETWORK.
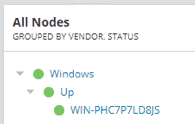
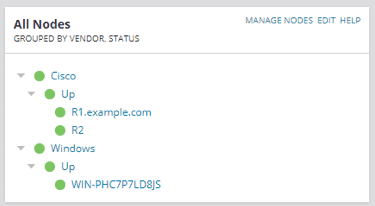
On the Summary page (which is customizable), we can see a list of the nodes, active alerts, a summary of events, maps, groups and even the option to search nodes.

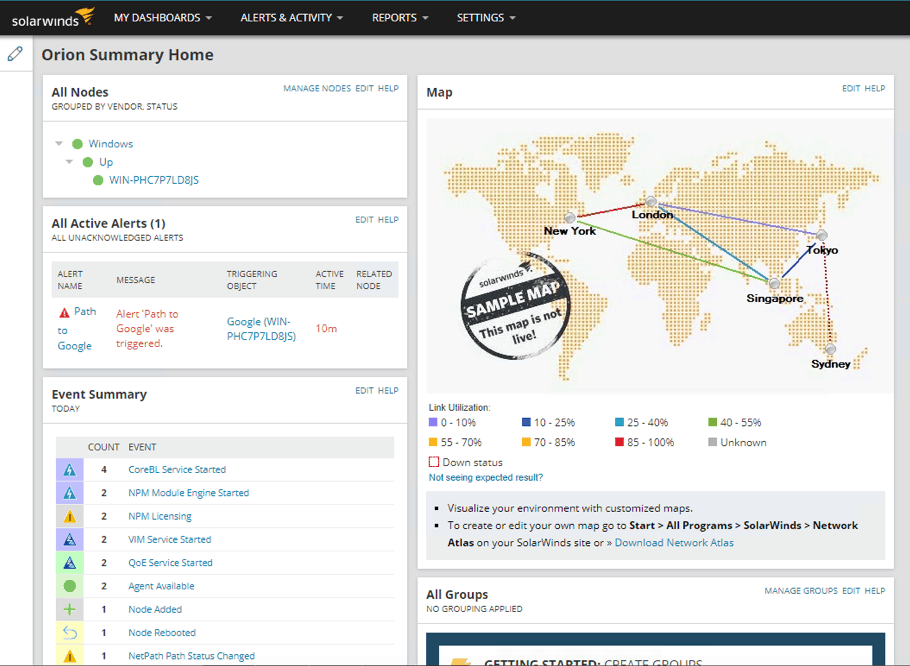
As you can see, the nodes are organized in groups by vendor and status. We can click on each group and status to view a specific node.

One cool thing with SolarWinds is that you can put your mouse pointer on a node or object and it will give a nice summary of that object.

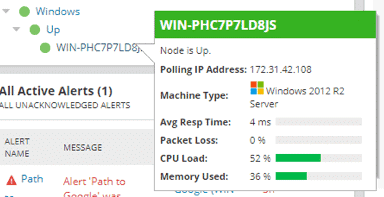
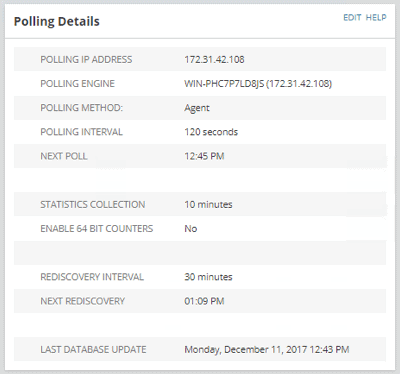
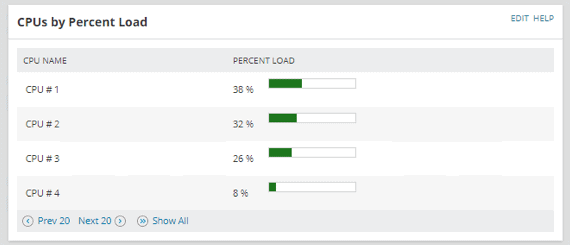
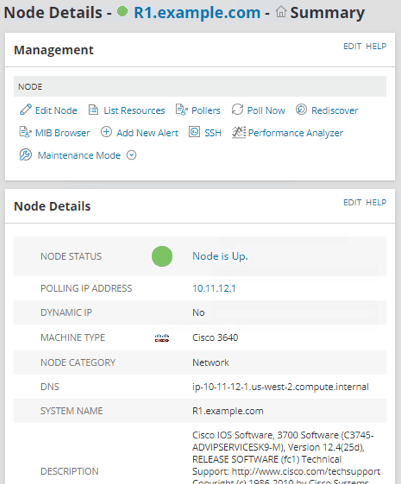
Clicking on a node will give us more details about that node like the status of the node, the active alerts for that node, polling details, availability statistics, CPU usage, and so on.
As you can see, SolarWinds NPM can get very granular and provide a wealth of information (almost drowning you in information).


Network Discovery
Let’s now run a network discovery so that SolarWinds NPM can also monitor our Cisco routers.
To do this, we will go to SETTINGS → Network Discovery.
This will bring up the Network Sonar Wizard which will guide you through choosing which IP addresses/subnets to scan, credentials and importing discovered devices.

It’s really just a Next…Next process. The first step is to define which network you want to scan. This can be done in several ways including:
- IP addresses ranges
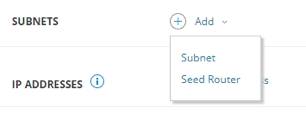
- Subnets which can be discovered using a seed router
- Individual IP addresses
- Querying Active Directory Domain Controller

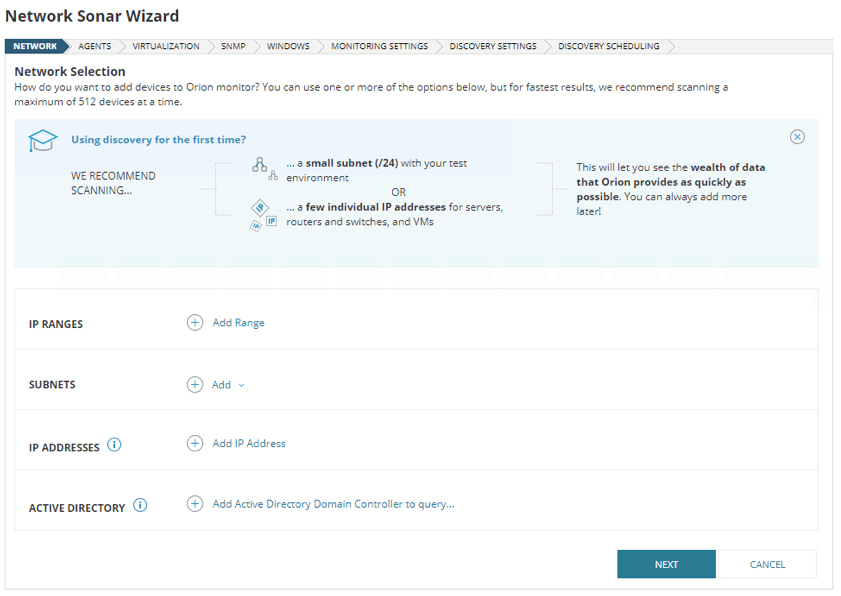
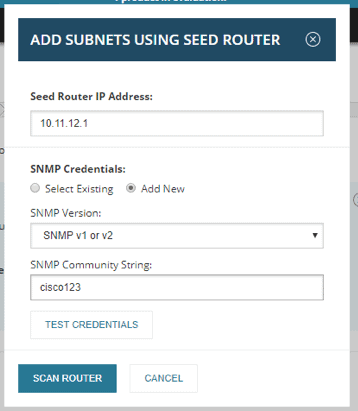
I personally like using the seed router option because I can just specify one IP address and the discovery tool will start its scan from that router and then hop from that device to discover other devices (as specified in the hop count option discussed below).


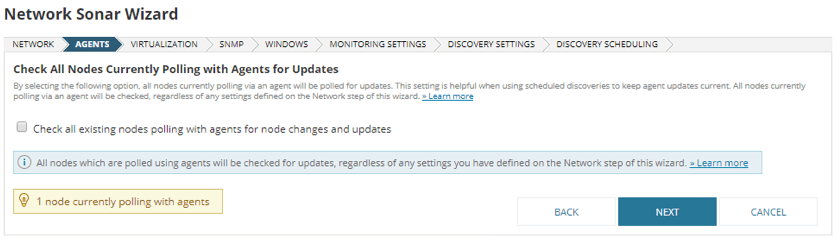
At the next step, you can choose to poll updates from all nodes that are currently being polled by agents. In our case, only the local server has an agent running on it.

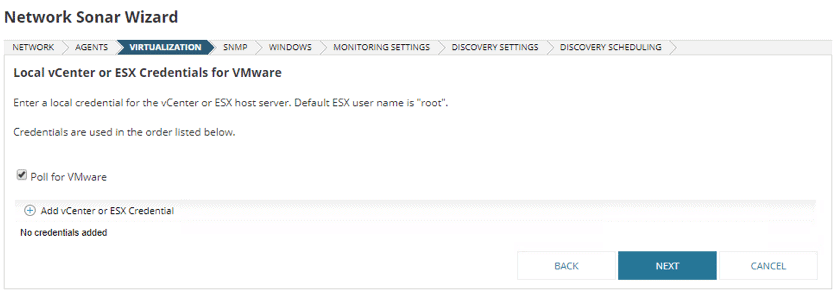
The next step asks for credentials for VMware systems. Since we are not using any VMware products, we will just uncheck that option and press Next.

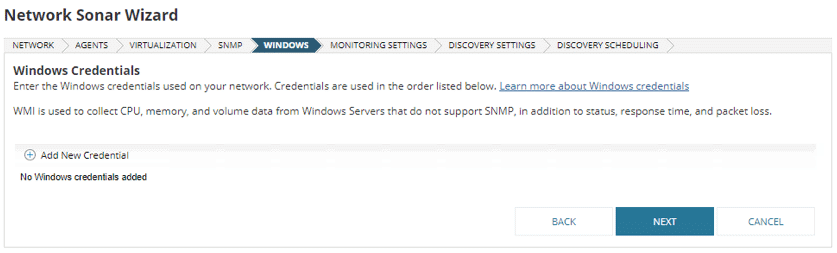
Next, you will be required to enter SNMP credentials. SNMP is one of the most important tools for network monitoring and management.
SolarWinds NPM also supports agents, ICMP and Windows Management Instrumentation (WMI) for polling.
Note: If you had to choose between SNMP and WMI, you should probably go for SNMP except in cases where SNMP does not support what you need, like Windows-specific information.
SNMP consumes less resources (bandwidth, CPU, etc.) and will usually work across a firewall or NAT connection.

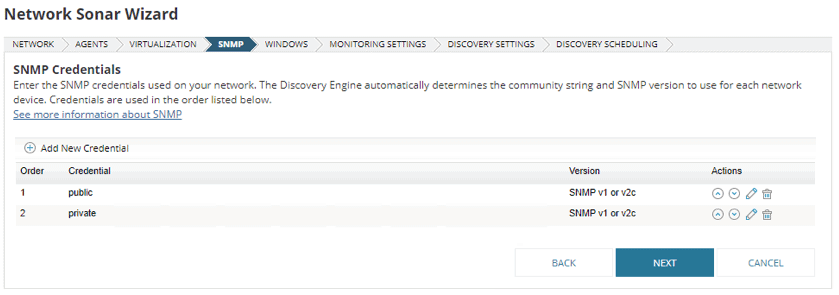
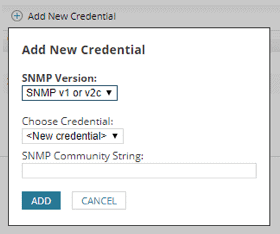
As you can see, the default “public” and “private” community strings are included in the wizard. For security reasons, you should never use these default community strings in your network. Also if possible, use SNMPv3 instead.
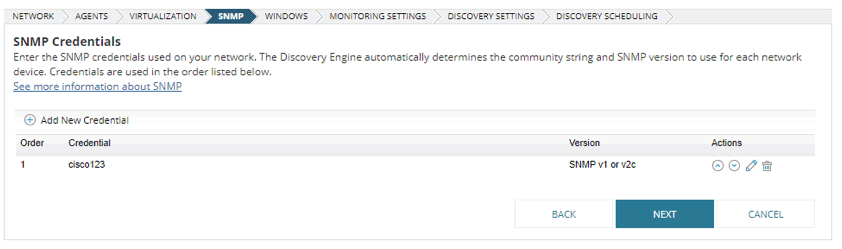
In our case, we will create a new community string of “cisco123” (SNMPv2c) which is what we configured on our Cisco routers.


Hint: You can also enable SNMP on other devices like Windows and Unix. Use this article as a guide.
On the next screen, we can enter WMI credentials. To use WMI, it will be easier if Active Directory is also being used in the environment so that one domain/username/password can be used for all servers instead of one combination for each server.

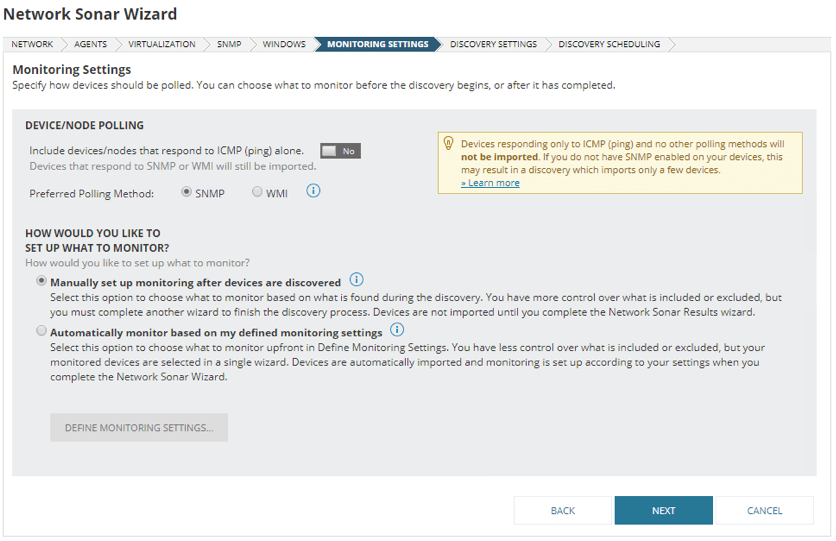
Next, you can specify how to monitor devices – either you manually select what to monitor for each device or you create a ‘blanket’ device monitoring setting for all devices.
The first option allows for more granular control so I will just leave it selected.

Next, we can customize the settings of the discovery like the name, description, SNMP timeout and so on.

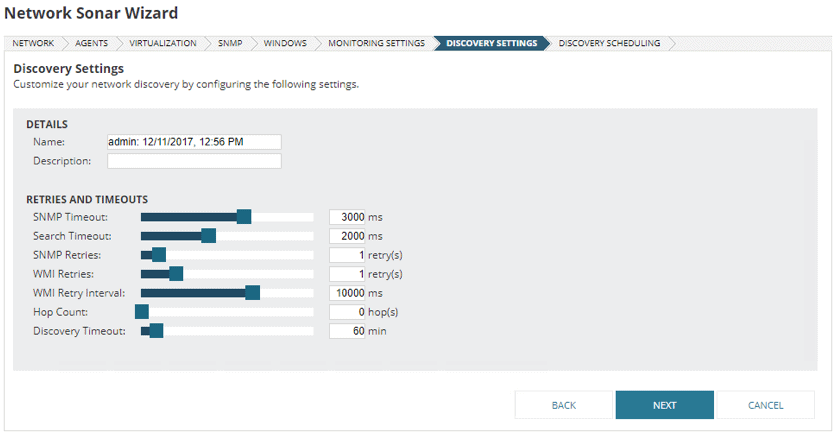
One option that I find very useful on this page is the ‘Hop Count’ which allows the Network Sonar Wizard extend its discovery to other hops of a discovered device.
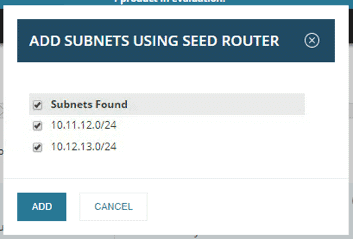
For example, since we only added the 10.11.12.0/24 and 10.12.13.0/24 subnets in our discovery, the network sonar wizard will only discover devices in those subnets.
However, let’s imagine that R2 is also connected to another subnet (e.g. 10.13.14.0/24). By increasing the hop count to something greater than 0, the network sonar wizard will attempt to discover devices in that subnet also.
The maximum hop count value is 10 and you should be careful with this setting because you can effectively lead the wizard down a rabbit hole.
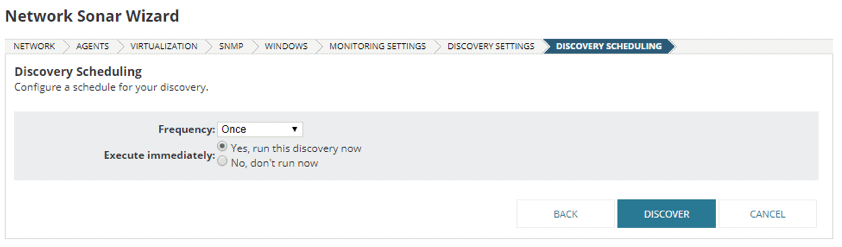
Finally, we can schedule how often we want to run the discovery.
Options include once, hourly, daily and advanced which allows you to choose specific dates/times to run the discovery.
On this screen, you can also choose to run the discovery immediately or sometime later.

The wizard is now ready to discover the network. This discovery can take anywhere from minutes to hours depending on how large the network is and the settings (like hop count) used.

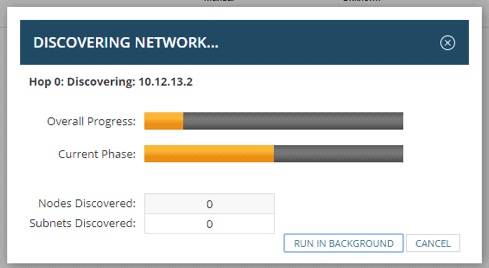
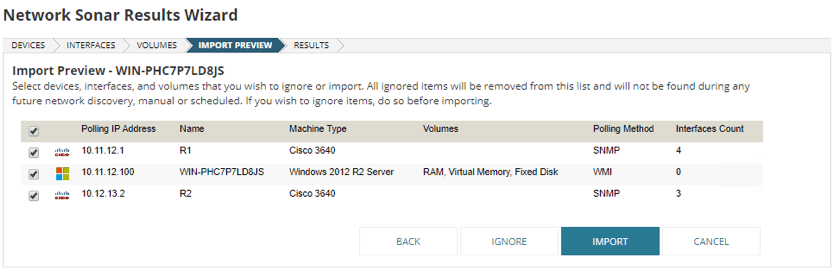
In a small network like ours, discovery shouldn’t take more than a few minutes and once it’s done, we should see the results showing the nodes discovered.

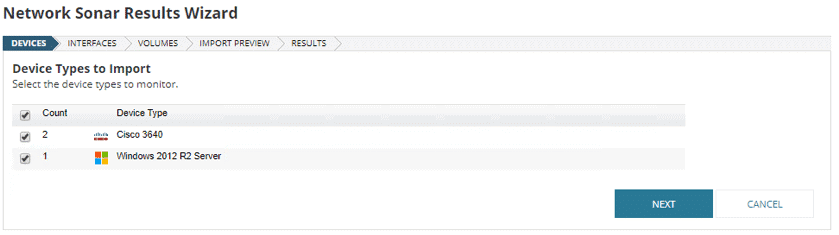
You can select and/or deselect the nodes you want to or don’t want to monitor. On the next two screens, you can specify the interfaces and volumes to monitor.

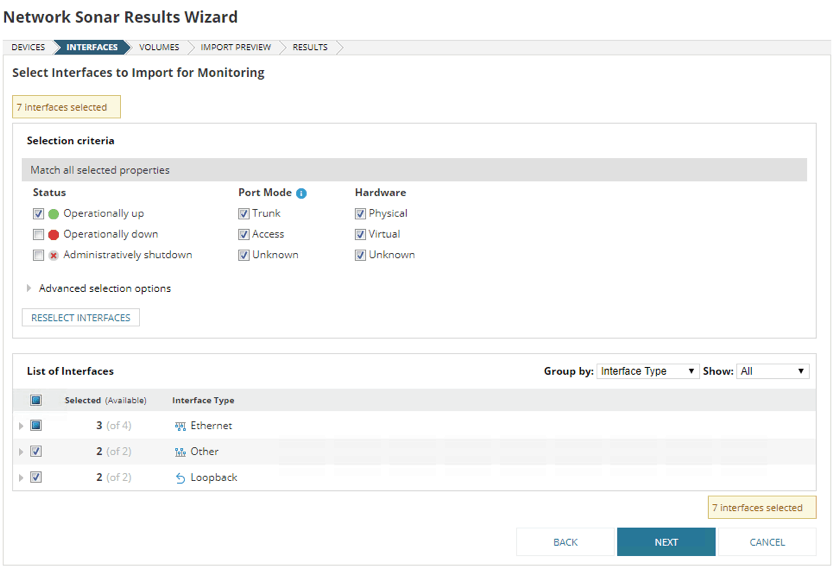

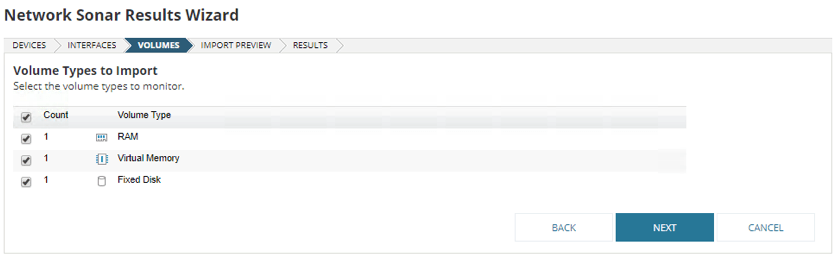
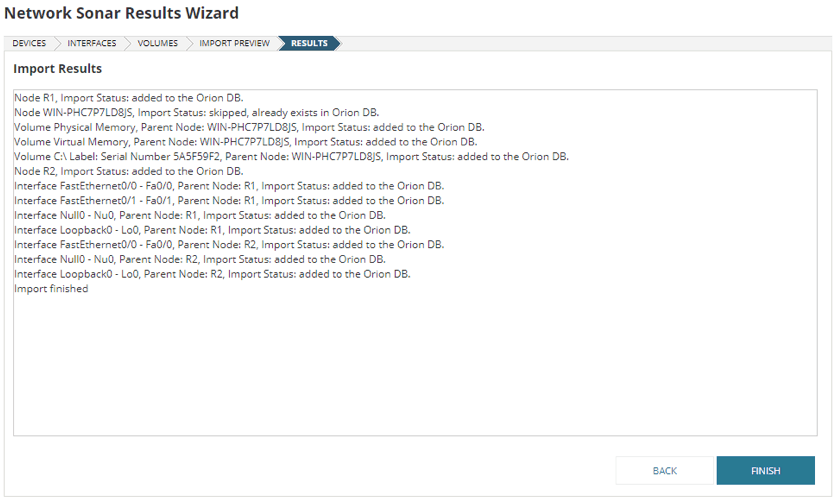
Finally, you can see a preview of the nodes to be imported and import them into the monitoring database.

At the end of the import, it will show you the import logs and then take you to the Discovery Central page.


Now if we go back to our Summary page, we should see our two Cisco routers along with the Windows server.

Like we did for the Windows Server, we can click on any of the Cisco routers to see more details.

There are a lot of things we can do right from the Orion web console like opening an SSH connection to the node or using the Performance Analyzer:

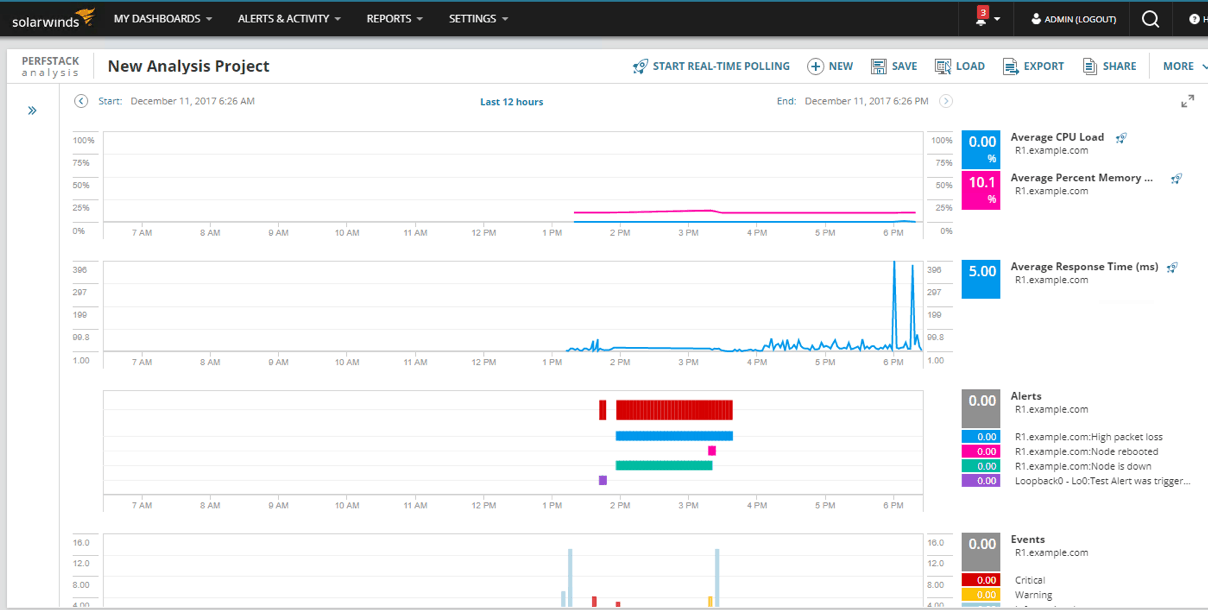
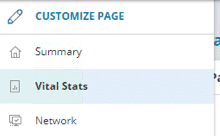
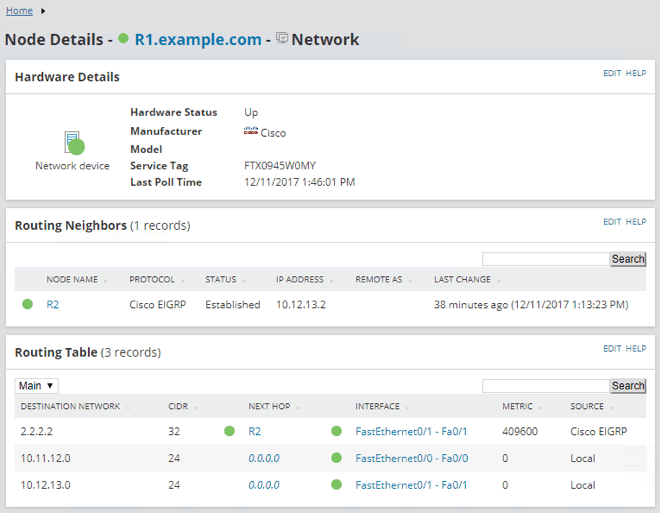
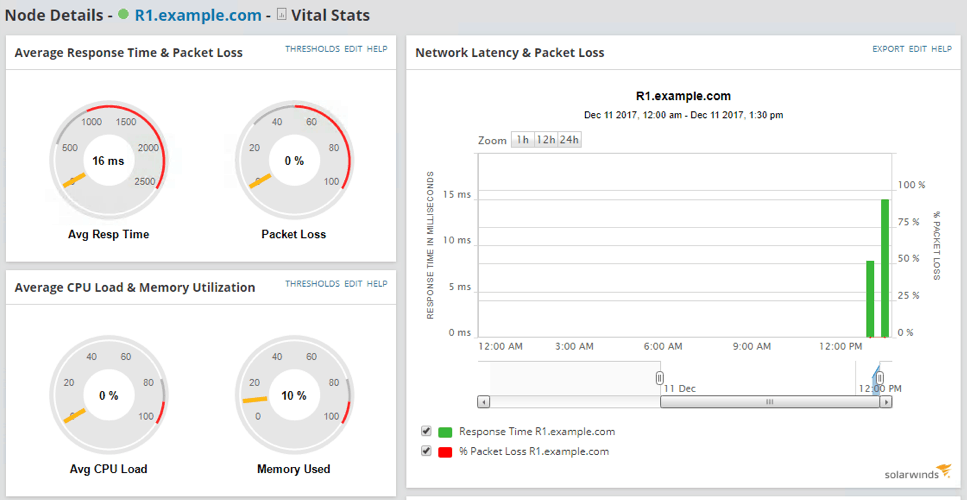
If you move your mouse to the left of the screen, you can also view more information about a node like vital statistics and network statistics.


Setting up Alerts in SolarWinds NPM
Apart from displaying alerts on the web console, a good network monitoring solution should also provide other avenues for notifying users of things happening on the network. Like with other things SolarWinds NPM does well, it has a great alerting system.
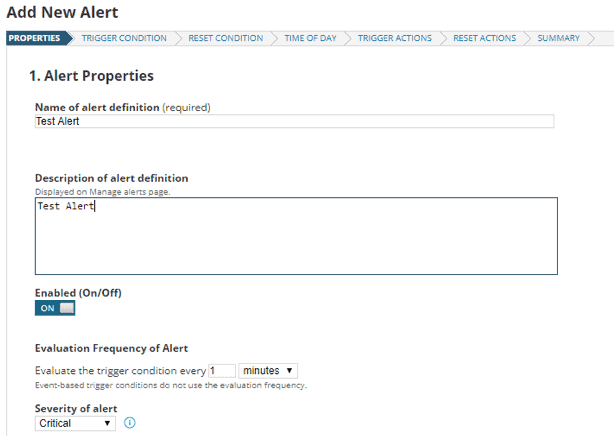
Let us set up a new alert for R1 such that if an interface has been down for more than 2 minutes, it should send an email to an administrator.
To begin, just click on the Add New Alert button.


Note: You can also set up alerts by navigating to ALERTS & ACTIVITY → Alerts → Manage Alerts and click ADD NEW ALERT under the ALERT MANAGER tab.
The first step is to configure the alert properties including the name, description, how often the trigger condition should be evaluated, the severity of the alert (e.g. critical, notice, warning), and even the category of users that should have access to the alert.

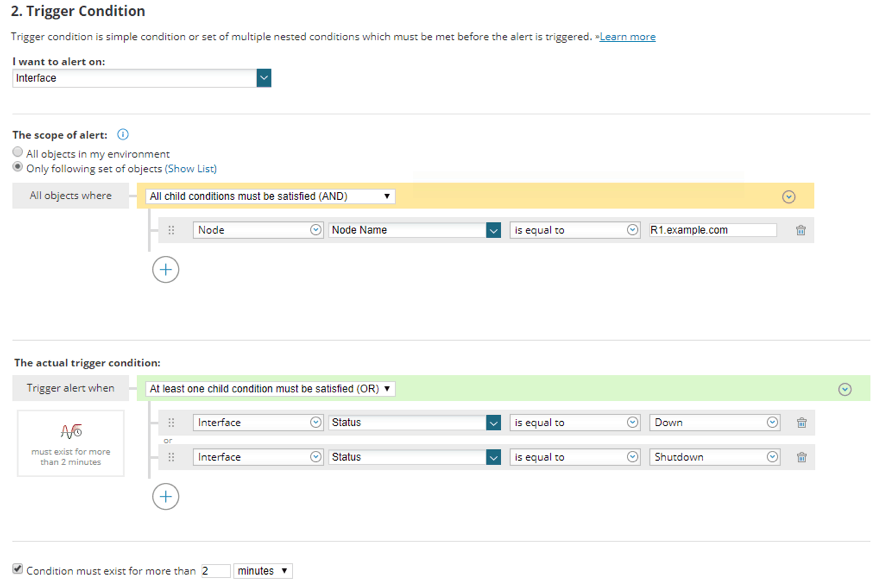
The next thing is to configure the trigger condition. You can get very granular here.
- You can trigger on a node, interface, group, VLANs and many more objects.
- You can also configure the scope of the alert, whether it should apply to all objects in your environment or to specific objects that meet certain criteria.
- Finally, you can configure the trigger condition itself e.g. if an interface goes down or is shut down. You can also specify for how long the condition should exist before the alert is triggered.
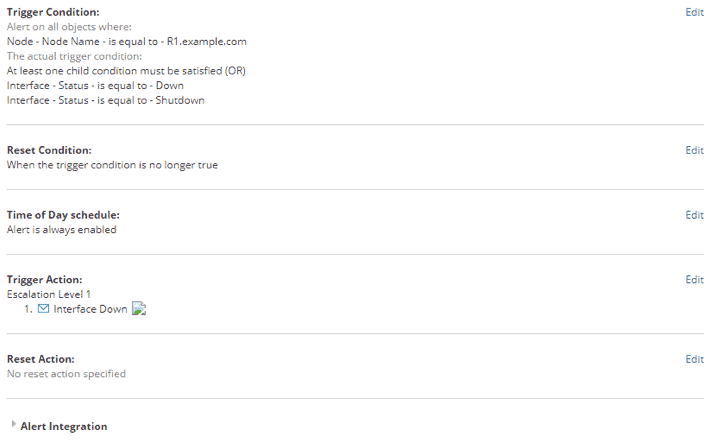
The trigger condition for our scenario is as shown below:

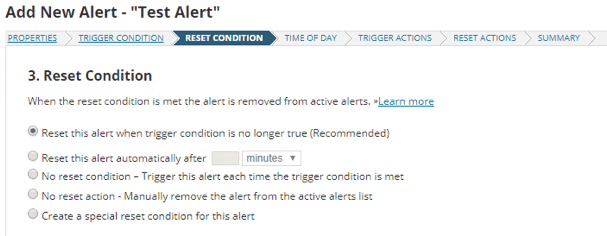
Next, you can set the reset condition – when the alert should be removed from active alerts.

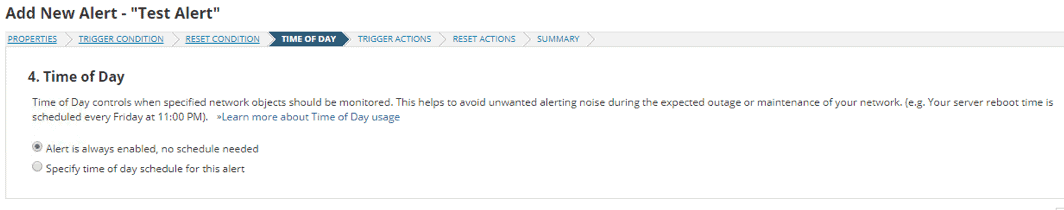
On the next screen, you can specify when the trigger condition should be evaluated, for example, always or on a specific time of the day.

We have now come to the second most interesting part (after the trigger condition) of an alert – the action that should be taken when an alert is triggered. By default, the alert will be shown in the Active Alerts page on the web console.

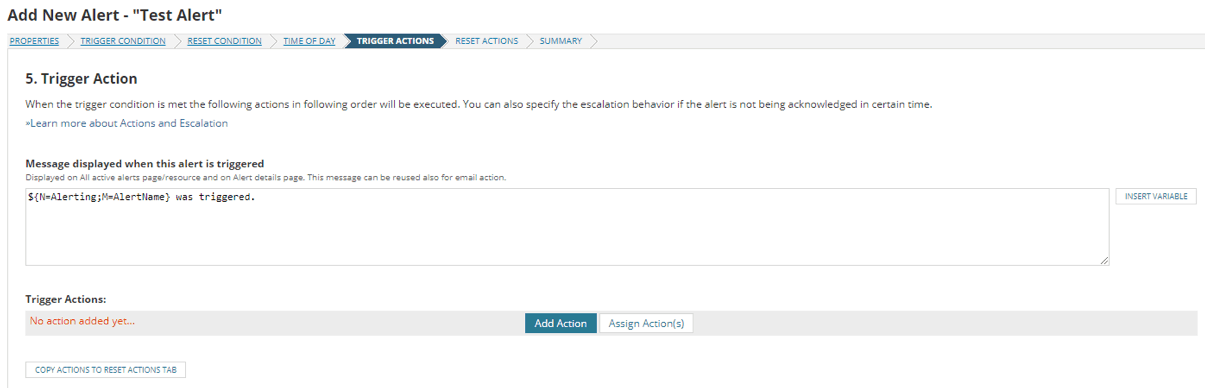
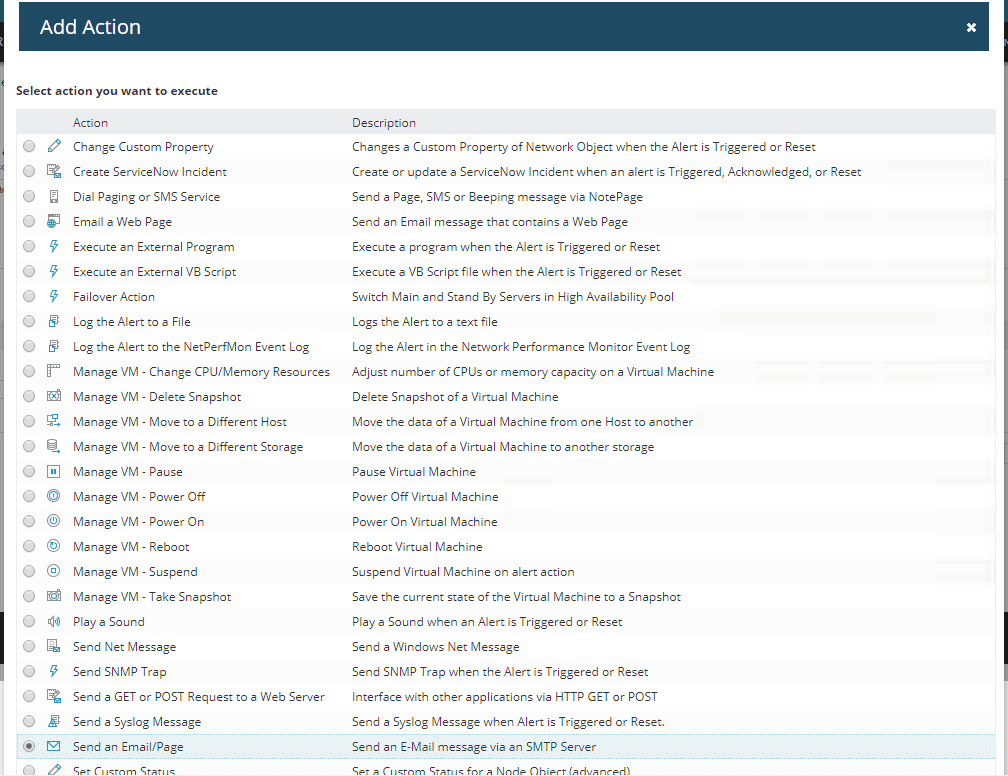
However, you can also add actions to an alert like sending an SMS, email, syslog message, executing a script and many more. This is one of the areas SolarWinds NPM excels – the numerous options it provides.
Related Post: What is Syslog

If you specify that you want to send an email, you have to configure an SMTP server.
Unfortunately, SolarWinds NPM does not come with its own SMTP server so you must have and configure your own (which should not be a problem in a production environment).
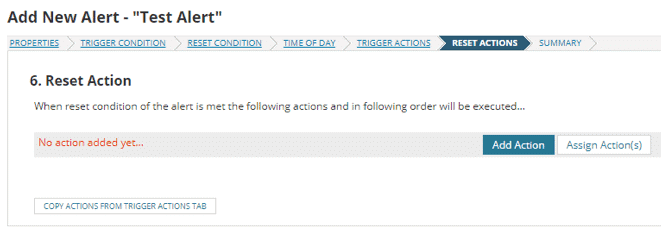
Finally, you can set a reset action which is the action that should be taken when the alert has cleared.

This will then bring you to the summary page of the alert you are about to create. If you are fine with it, click the SUBMIT button. Otherwise, click on the relevant Edit link and make the necessary changes.

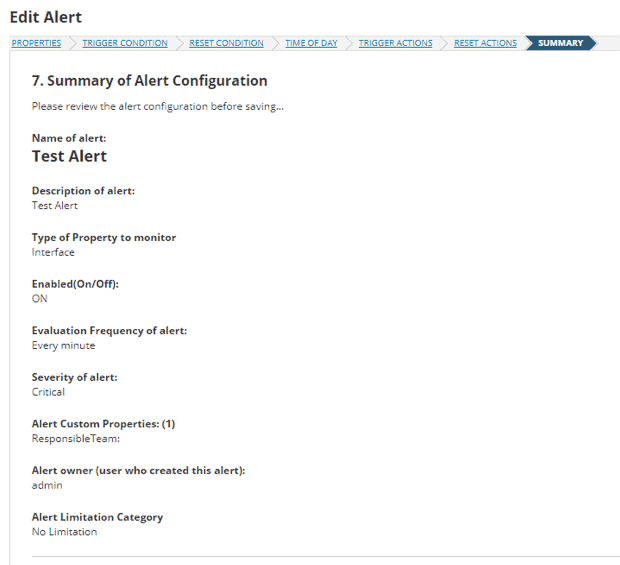

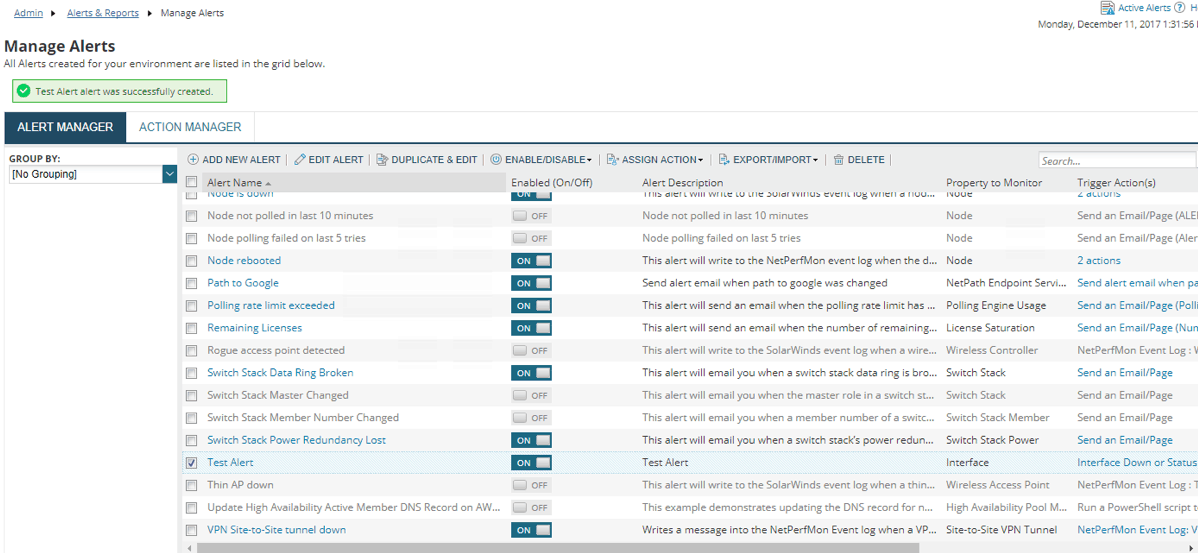
When the alert has been successfully created, you will be redirected to the ALERT MANAGER page.

To test our alert, I will shut down the loopback interface on R1.
interface lo0

shutdown
Even though the alert we created won’t be triggered immediately, we should see this change in the Events page on the web console.

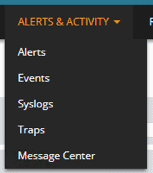

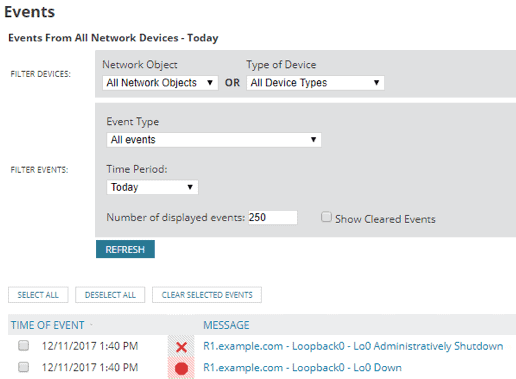
After about 2 minutes, if we check the Alerts page (ALERTS & ACTIVITY → Alerts), we should see that our Test Alert has been triggered.

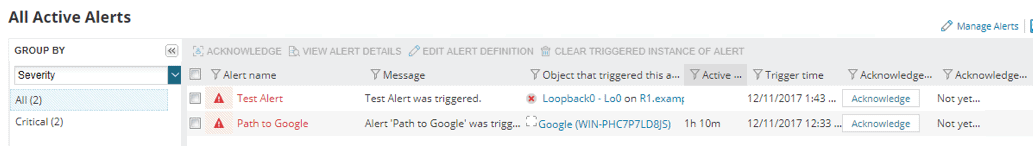
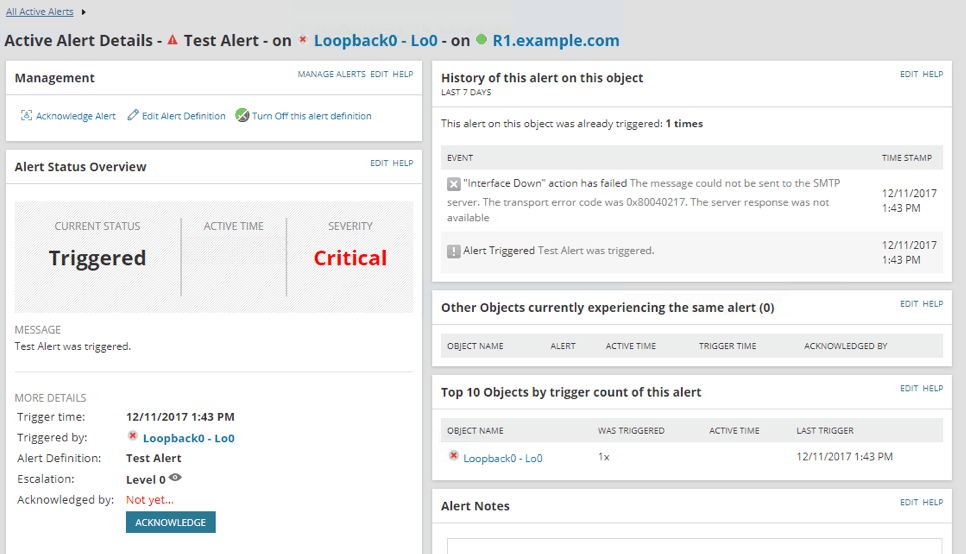
You can click on the alert to get more information about it and also to acknowledge it.

Note: I did not have an SMTP server to use for the email test (Gmail didn’t work); so I could not receive any email from SolarWinds NPM.
Reports
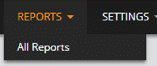
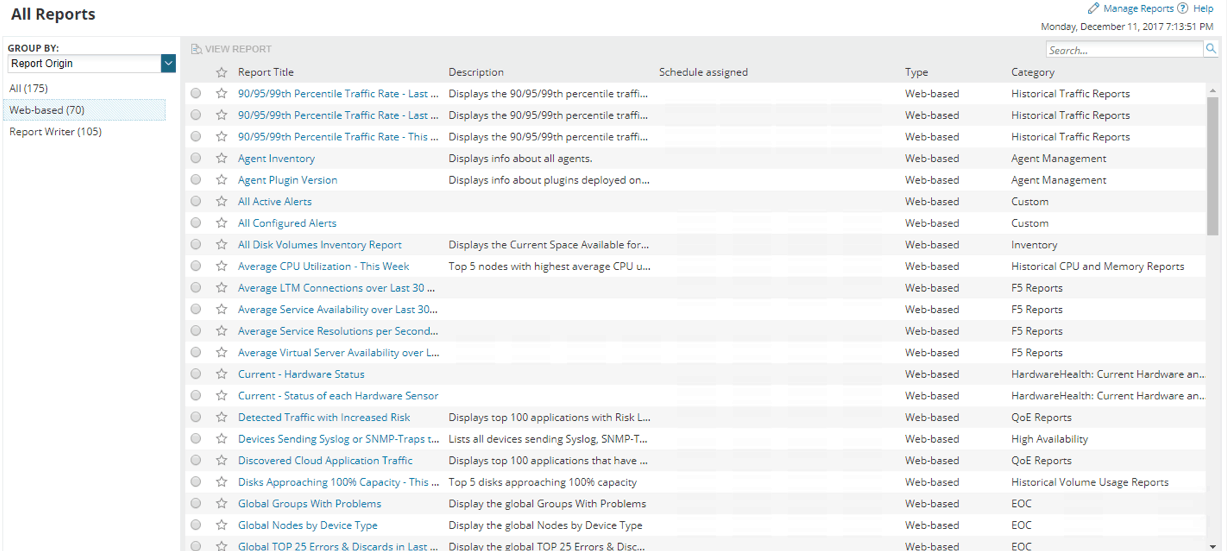
SolarWinds NPM also has awesome report generating capability. You can navigate to REPORTS → All Reports to view all the report templates.

There are over 70 default web reports apart from the fact that you can create your own custom reports.

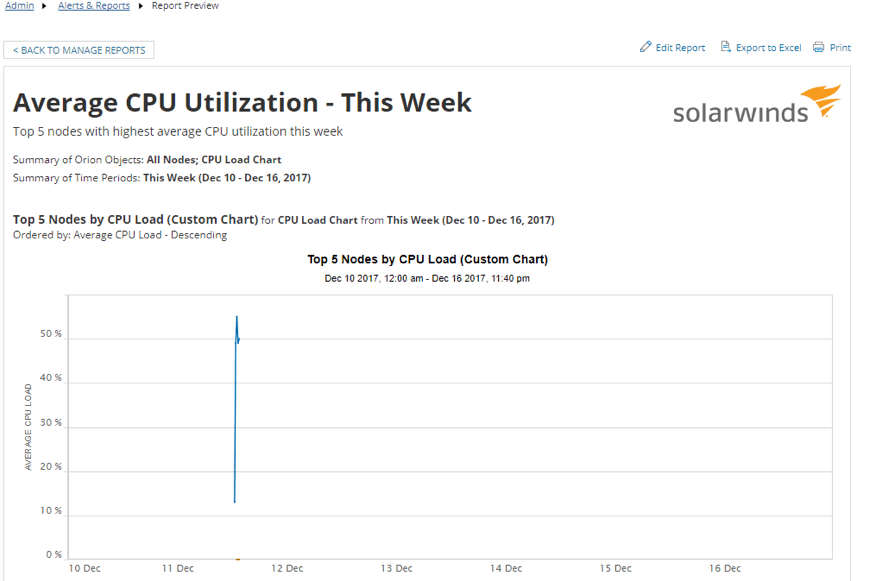
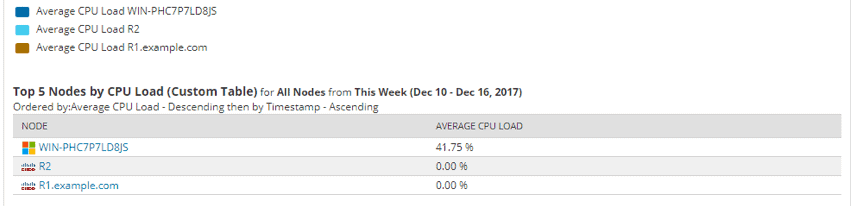
A sample of the “Average CPU Utilization – This Week” report is shown below:


Conclusion
HIGHLY Recommended!
SolarWinds NPM is a really cool Network Monitoring tool that can provide a wealth of information like availability, health and performance monitoring, and bandwidth analysis. It has an awesome tool for performing network discovery and it provides highly customizable alerts and reports. Moreover, other SolarWinds products can be added to extend the functionality of NPM.
On the downside, the enormous capability of NPM comes at the expense of being “bulky”. You’ll need a server that will be able to handle the options that SolarWinds NPM gives you and crunch through large amounts of data and analysis to really get the most of this software.
SolarWinds comes competitively priced starting at $2,895 for monitoring 100 elements. An element can be an interface, node or volume. This is the industry standard licensing as seen in many popular Network monitoring solutions found today. SolarWinds NPM licensing model is explained here.
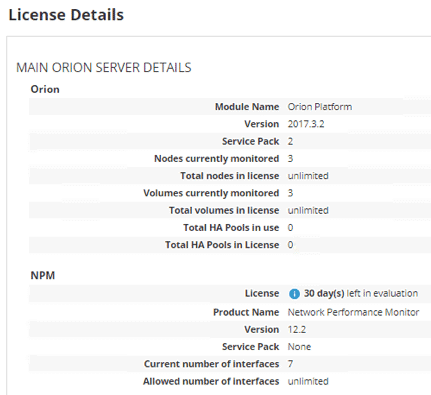
You can view your license details by going to SETTINGS → All Settings → License Details.

Download a Free 30 Day trial of SolarWinds Network Performance monitor and follow along with this review/howto Guide to get monitoring within Minutes! You have 30 full days of using the program to get a feel of how well it monitors, analyzes and alerts you of issues and more!
![]()
![]()
Related Post: Best Server Monitoring Tools


![Toni Kroos là ai? [ sự thật về tiểu sử đầy đủ Toni Kroos ]](https://evbn.org/wp-content/uploads/New-Project-6635-1671934592.jpg)


