
Pollution Facts – AQLI
Particulate matter (PM) air pollution, which is predominantly the result of fossil fuel combustion, is recognized as the most deadly form of air pollution globally. The AQLI demonstrates that averaged across all women, men, and children globally, particulate air pollution cuts global life expectancy short by nearly 2.2 years relative to if particulate concentrations everywhere were at the level deemed safe by the World Health Organization (WHO). This life expectancy loss makes particulate pollution more devastating than communicable diseases like tuberculosis and HIV/AIDS, behavioral killers like cigarette smoking, and even war. Some areas of the world are impacted more than others. For example, in the United States, where there is less pollution, life expectancy is cut short by just 0.1 years relative to the WHO guideline. In China and India, where there are much greater levels of pollution, bringing particulate concentrations down to the WHO guideline would increase average life expectancy by 2.6 and 5.9 years, respectively.
“Particulate air pollution shortens lives globally, even more than cigarettes. There is no greater current risk to human health.” – Michael Greenstone,
Milton Friedman Distinguished Service Professor in Economics,
University of Chicago
Mục Lục
How Does Particulate Air Pollution Impact Health?
Particulate matter (PM) refers to solid and liquid particles – soot, smoke, dust, and others – that are suspended in the air. When the air is polluted with PM, these particles enter the respiratory system along with the oxygen that the body needs.
When PM is breathed into the nose or mouth, each particle’s fate depends on its size: the finer the particles, the farther into the body they penetrate. PM10, particles with diameters smaller than 10 micrometers (μm) whose concentration in the air is included in measures of “total suspended matter” (TSP), are small enough to pass through the hairs in the nose. They travel down the respiratory tract and into the lungs, where the metal elements on the surface of the particles oxidize lung cells, damaging their DNA and increasing the risk of cancer.[1] The particles’ interactions with lung cells can also lead to inflammation, irritation, and blocked airflow, increasing the risk of or aggravating lung diseases that make breathing difficult, such as chronic obstructive pulmonary disorder (COPD), cystic lung disease, and bronchiectasis.[2]
More deadly is an even smaller classification: PM2.5, or particles with diameter less than 2.5 μm—just 3 percent the diameter of a human hair. In addition to contributing to risk of lung disease, PM2.5 particles pass even deeper into the lungs’ alveoli, the blood vessel-covered air sacs in which the bloodstream exchanges oxygen for carbon dioxide. Once PM2.5 particles enter the bloodstream via the alveoli, they inflame and constrict blood vessels or dislodge fatty plaque, increasing blood pressure or creating clots. This can block blood flow to the heart and brain, and over time, lead to stroke or heart attack. In recent years, researchers have even begun to observe that PM pollution is associated with lower cognitive function. They speculate that PM2.5 in the bloodstream may cause the brain to age more quickly due to the inflammation. In addition, it may damage the brain’s white matter, which is what allows different regions of the brain to communicate.[3] White matter damage, such as due to the decreased blood flow that PM2.5 may cause, has been linked to Alzheimer’s and dementia.[4]

The tiny size of PM2.5 particles not only makes them harmful from a physiological perspective, but also allows these particles to stay in the air potentially for weeks and to travel hundreds or thousands of kilometers.[5] This increases the likelihood that the particles will end up inhaled by humans before depositing onto the ground.
The Air Quality Life Index translates long-term exposure to particulate pollution concentrations into their impact on life expectancy. The AQLI’s core finding is that sustained exposure to an additional 10 micrograms per cubic meter (μg/m3) of PM2.5 reduces life expectancy by 0.98 years. This means that Shanghai’s residents could expect to live 2.3 years longer if it permanently reduced concentrations to the WHO guideline. In the United States, where the severity of particulate pollution is generally relatively small compared to that in many other countries, California’s Central Valley residents could expect to live up to six months longer than they currently would if particulate pollution in the city were reduced to the WHO guideline.
How Does Particulate Air Pollution Stack Up Against Other Health Threats?
Though we know it is possible for people to live to 80, 90, or even longer, the average infant born in 2019 is expected to live to be 73. Life expectancies are cut short for many reasons, including illnesses such as smoking, tuberculosis, and HIV/AIDS—some of the most deadly culprits. The AQLI shows that particulate air pollution cuts life expectancy shorter than all of these causes.
According to the AQLI, if current particulate pollution levels persist, today’s global population will lose a total of 16.9 billion years of life directly due to this particulate pollution. That means, the average person loses about 2.2 years of life. But, if particulate pollution around the world was reduced to the WHO guideline of 10 μg/m3 and everything else stayed the same, global average life expectancy at birth would increase by 2.2 years to about 75 years.
To put this in perspective, first-hand cigarette smoke leads to a reduction in global average life expectancy of about 1.9 years. Alcohol and drug use reduce life expectancy by 9 months. Unsafe water and sanitation take off 7 months. HIV/AIDS cut lives short 4 months, and malaria, 3 months. Conflict and terrorism take off just 7 days. So, the impact of particulate pollution on life expectancy is comparable to that of smoking, almost three times that of alcohol and drug use and unsafe water, five times that of HIV/AIDS, and 114 times that of conflict and terrorism.[6]

Comparing the impact of particulate pollution to other health threats can be surprising. As an example, the health discourse in Sub-Saharan Africa has centered on infectious diseases such as HIV/AIDS and malaria. About 10% of health expenditures in the region go towards combating HIV/AIDS or malaria. However, a comparison shows that particulate pollution’s impact on life expectancy is no less serious. In Nigeria and the Democratic Republic of Congo, air pollution is the biggest threat in terms of its impact on life expectancy—shaving off more years than HIV/AIDS, unsafe water and sanitation and malaria. In Ghana, it ranks as the deadliest of threats, while in Cote d’Ivoire it is second to malaria and shaves 2 years off of life expectancy.

What accounts for particulate pollution’s enormous overall impact? The key difference is that residents of polluted areas can do very little to avoid particulate pollution, since everyone breathes the air. In contrast, it is possible to quit smoking and take precautions against diseases. Thus, air pollution affects many more people than any of these other conditions: 82 percent of the global population, or 6.2 billion people, live in areas where PM2.5 exceeds the WHO guideline. So, although other risks such as HIV/AIDS, tuberculosis, or war have a larger impact among the affected, they affect far fewer people. For example, the Global Burden of Disease estimates that those who died from HIV/AIDS in 2019 died prematurely by an average of 52.9 years. However, since the 36 million people affected by the disease is tiny compared to the 6.2 billion people breathing polluted air, the overall impact of air pollution is much greater.
Where Is Particulate Air Pollution Cutting Life Expectancy The Most?
Just like with other public health threats, the burden of air pollution is not borne equally by everyone around the world. Developing and industrializing Asian countries are impacted the most by particulate pollution.

If all areas not in compliance with the WHO PM2.5 guideline in 2019 were to permanently reduce their particulate pollution levels to meet the guideline, then, globally:
- 510 million people, all in northern India would live at least 8.5 years longer on average. These people represents nearly 40 percent of India’s current population.
- An additional 1 billion people would live at least 5 years longer on average. These include 82 percent of Bangladeshis, 49 percent of Nepalis, 31 percent of Peruvians, 54 percent of Indians, 13 percent of Indonesians, 13 percent Nigerians, and 7.4 million Chinese.
- An additional 1.3 billion people would live at least 3 years longer on average. These include all Singaporeans, 40 percent of Nepalis, 33.5 percent of Indians, 38 percent of Pakistanis, 38 percent of Chinese, 19 percent of Indonesians, 46 percent of Nigerians, 15 percent of Bangladeshis, and others in Bhutan, Peru, Malaysia, Bahrain, and the Democratic Republic of the Congo.
- An additional 3.9 billion people around the world are exposed to particulate pollution concentrations above the WHO guideline. They would gain an average of 1 year.
Four countries that account for nearly a quarter of the world’s population are also among the most polluted: Bangladesh, India, Nepal and Pakistan. These four countries are ranked among the five most polluted countries in the world, accounting for 60 percent of the person-years that would be lost globally if these pollution levels persist. Average life expectancy across these four countries would be 5 years higher if pollution concentrations complied with the WHO guideline.
On average, people in India would live 5.9 years longer if their country met the WHO guideline. Since life expectancy at birth is currently 71 years in India, this suggests that reducing particulate pollution to the WHO guideline throughout the country would raise the average life expectancy to about 77. In comparison, resolving unsafe water and sanitation would increase the average life expectancy to 72.
By contrast, the US and Europe, which make up 18 percent of the world’s population, account for less than 2 percent of the health burden of particulate pollution. In the United States, about a third of the population lives in areas not in compliance with the WHO guideline. Those living in the country’s most polluted counties could expect to live up to one year longer if pollution met the WHO guideline.
Learn more about the impact of air pollution policies here. To learn how many years of life expectancy are lost in countries and regions around the world under current pollution levels, see The Index.
Where Does Particulate Air Pollution Come From?
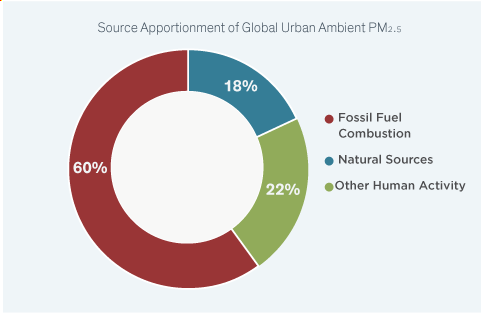
Though some particulates arise from natural sources such as dust, sea salt, and wildfires, most PM2.5 pollution is human-induced.
The fact that burning coal pollutes the air has been known for some time. Around 1300, King Edward I of England decided that the punishment for anyone who burned coal in his kingdom would be death. Today, fossil fuel combustion is the leading global source of anthropogenic PM2.5,[7] acting through three distinct pathways[8]:
- First, because coal contains sulfur, coal-fired power plants and industrial facilities generate sulfur dioxide gas. Once in the air, the gas may react with oxygen and then ammonia in the atmosphere to form sulfate particulates.
- Second, combustion that occurs at high temperatures, such as in vehicle engines and power plants, releases nitrogen dioxide, which undergoes similar chemical reactions in the air to form nitrate particulates.
- Finally, diesel engines, coal-fired power plants, and burning of coal for household fuel all involve incomplete combustion. In this type of combustion, not enough oxygen is present to generate the maximum amount of energy possible given the amount of fuel. Part of the excess carbon from the fuel becomes black carbon, a component of PM2.5 that is also the second- or third-most important contributor to climate change after carbon dioxide and perhaps methane.
In addition to fossil fuel combustion, humans generate PM2.5 through the combustion of biofuels such as wood and crop residue for household cooking and heating. Biofuel burning emits black carbon and organic particulates. In many parts of the world, biofuel combustion’s contribution to particulate pollution is comparable to that of fossil fuels. The burning of biomass—forests, savannah, and crop residue on fields—to clear land for agriculture is also a significant source of anthropogenic particulate pollution.[9]
Why Is There So Much Particulate Pollution?
Fossil fuels are today the cheapest form of energy, and energy is crucial to raising living standards through economic growth.
As the first figure shows, there simply aren’t examples of countries attaining high levels of living standards without consuming high levels of energy. It should then come as no surprise that today’s developing (i.e. non-OECD) countries are expected to consume more energy with time as they grow.

Much of the world’s rising demand for energy is projected to continue to come from fossil fuels. Based on policies in place and committed at the end of 2016, fossil fuels should supply 74% of the world’s primary energy in 2040, compared to 81% in 2014, according to International Energy Agency.

Why is the world projected to continue to rely so heavily on fossil fuels, even though we know they lead to air pollution and climate change? This is because they are inexpensive and their price does not take into account the costs of pollution and climate change—or what economists call “externalities.”
For example, a kilowatt-hour (kWh) of energy from a new coal plant that had all the environmental controls required in the United States would cost only about 8 cents. And without those environmental controls, the cost would be only about 3 cents per kWh. Due to the hydraulic fracturing revolution, the cost of a kWh of electricity from a combined cycle natural gas plant is about 5.5 cents per kWH in the United States. In contrast, the cost of low-carbon sources such as nuclear or renewables (with natural gas back-ups to deal with intermittency) are two or three times as much.

Not only are fossil fuels cheap, they are also abundant. The world is not going to run out anytime soon. There is about 55 years-worth of oil alone, more than a century of natural gas, and endless amounts of coal, while oil and gas companies will continue to innovate to find more.
How Has The Impact of Particulate Pollution Changed Over Time?
Air pollution is a stubborn problem. Over the last two decades, from 1998-2019, particulate pollution cut global life expectancy short on average by about 2.2 years relative to if the world met the WHO guideline. Global pollution exposure peaked in 2012. If that year’s pollution levels had been sustained, average life expectancy would be 2.6 years shorter. By 2019, however, average pollution exposure and its life expectancy impact were back down to 1998 levels.

To make sense of this global average trend, it is necessary to decompose it by region. In many developing countries, mostly in Asia and Africa, the story is not of an increase and decrease, but only a fairly consistent increase in particulate pollution between 1998 and 2019. In Bangladesh, India, Nepal, and Pakistan – the four South Asian countries that account for nearly a quarter of the global population and are among the world’s most polluted countries today – the average resident is exposed to particulate pollution levels that are 35 percent higher than in 2000. The increase is not surprising. Over the course of the last 20 years, industrialization, economic development, and population growth have led to skyrocketing energy demand in these countries. In India and Pakistan, the number of vehicles on the road has increased about four-fold since the early 2000s. In Bangladesh, the number of motor vehicles has roughly tripled just from 2010 to 2020. In Bangladesh, India, Nepal, and Pakistan combined, electricity generation from fossil fuels tripled from 1998 to 2017. [10] Crop burning, brick kilns, and other industrial activity also contribute to rising particulate pollution in the region.
At the same time, the United States and Europe have seen their particulate pollution decrease in the past decades. Once home to the world’s pollution capitals during periods of industrialization—with pollution levels perhaps rivalling those in the most polluted countries today—the offshoring of polluting industries abroad and, crucially, well-implemented air pollution policies have played large roles in cleaning up the air in these countries. Today, the average American is exposed to particulate pollution levels that meet the WHO guideline, while the average Briton loses about a month of life due to particulate pollution exposure above the WHO guideline.
The decline in global average pollution exposure in recent years is largely driven by progress in China, where almost three-quarters of the global reduction in particulate pollution came from. Similar to South Asian countries, China experienced decades of mounting pollution, with average exposure to particulate pollution growing by about 20 percent from 1998-2013. In 2013, northern China experienced some of its highest pollution levels to that point, and public criticism reached new heights. The very next year, Premier Li Keqiang declared a “war against pollution.” The National Air Quality Action Plan set aside $270 billion and the Beijing city government set aside an additional $120 billion to reduce ambient air pollution. Across all urban areas, the Plan aimed to reduce particulate matter (PM10) by 10 percent in 2017 relative to 2012 levels. The most heavily polluted areas in the country, including Beijing-Tianjin-Hebei, the Pearl River Delta, and the Yangtze River Delta, were given specific targets.
China met its target, reducing pollution at an unprecedented pace. Between 2013 and 2018, particulate pollution exposure declined by an average of 29 percent across the Chinese population. If that reduction is sustained, it would equate to a gain in life expectancy of 1.5 years. For the coming years, China has plans to further reduce air pollution concentrations.
Have Countries Overcome The Particulate Pollution Problem?
The dual challenges of economic growth and environmental quality faced by places like Beijing and Delhi today are no different from those once confronted by London, England, Los Angeles, California, or Osaka, Japan—once respectively known as “the big smoke,” “the smog capital of the world,” and the “smoke capital”—during their periods of industrialization.
The legacy of environmental improvement in these former pollution capitals—but now, rich, vibrant, and much cleaner cities—is evidence that today’s pollution does not need to be tomorrow’s fate. However, the air did not become cleaner in these countries by accident. It was the result of forceful policies. In the United States, for example, air pollution has dropped by about 62% since the Clean Air Act was passed in 1970, and Americans are living 1.4 years longer because of it. Similarly, in England, pollution has reduced since the passage of the Clean Air Act of 1956. In Japan, a series of lawsuits and environmental protection laws that began in the 1960s have helped to reduce air pollution to levels similar to those in Europe.
These changes, however, cannot happen overnight. Learn more about the impact policies around the world have had in reducing air pollution.
Does Particulate Pollution Have Anything To Do With Climate Change?
While the current air pollution challenge is largely concentrated in developing countries, decisions in these countries about fossil fuels usage, which is the primary source of particulate air pollution, will affect the entire world. That’s because the combustion of the same fossil fuels that releases life-threatening air pollution also involves the release of greenhouse gases that increase the odds of disruptive climate change. And, unlike air pollution that is highly localized, climate change doesn’t care where you live. It will impact all countries. For example, unmitigated climate change will make the United States poorer and more unequal—with the poorest third of U.S. counties projected to sustain economic damages costing as much as 20% of their income if warming proceeds unabated, according to research from the Climate Impact Lab, a a first-of-its-kind multidisciplinary effort working to enhance understanding of the social and economic costs of climate change.[11]
[1] Xing, et al., 2016
[2] E.g. Ling & van Eeden, 2009
[3] Gibbens, 2018
[4] Iadecola, 2013
[5] Wilson & Suh, 1997
[6] Calculations based on GBD 2016
[7] Philip et al., 2014
[8] NRC, 2010
[9] Philip et al., 2014
[10] Statistical Year Book of India, 2017, Table 20.4; Pakistan Statistical Pocket Book, 2006, Table 17.5 and Pakistan Today, 2019; Bangladesh Road Transport Authority, 2020; US Energy Information Administration.
[11] Hsiang et al., 2017
Notes and Sources
Gibbens, S. (2018). Air pollution robs us of our smarts and our lungs. National Geographic. Retrieved from https://www.nationalgeographic.com/environment/2018/09/news-air-quality-brain-cognitive-function/?user.testname=none
Global Burden of Disease. (2017). Retrieved from http://ghdx.healthdata.org/gbd-2017
Hsiang, S., Kopp, R., Jina, A., Rising, J., Delgado, M., Mohan, S., … & Larsen, K. (2017). Estimating economic damage from climate change in the United States. Science, 356(6345), 1362-1369.
Iadecola, C. (2013). The pathobiology of vascular dementia. Neuron, 80(4), 844-66.
India Ministry of Statistics and Programme Implementation. (2017). Motor vehicles – Statistical year book India 2017. http://mospi.nic.in/statistical-year-book-india/2017/189
Ling, S. H., and van Eeden, S. F. (2009). Particulate matter air pollution exposure: role in the development and exacerbation of chronic obstructive pulmonary disease. International journal of chronic obstructive pulmonary disease, 4, 233-43.
National Research Council. (2010). Global Sources of Local Pollution: An Assessment of Long-Range Transport of Key Air Pollutants to and from the United States. Washington, DC: The National Academies Press.
Pakistan Bureau of Statistics. (2006). Pakistan statistical pocket book 2006. http://www.pbs.gov.pk/content/pakistan-statistical-pocket-book-2006
Pakistan Today. (2019, June 16). Registered vehicles in Pakistan increased by 9.6% in 2018. https://profit.pakistantoday.com.pk/2019/06/16/registered-vehicles-in-pakistan-increased-by-9-6-in-2018/
Philip, S., Martin, R.V., van Donkelaar, A., Lo, J.W., Wang, Y., Chen, D., …, Macdonald, D.J. (2014). Global chemical composition of ambient fine particulate matter for exposure assessment. Environmental Science & Technology, 48(22), 13060-13068.
US Energy Information Administration. (n.d.). International: Electricity [Data set]. https://www.eia.gov/international/data/world/electricity/electricity-generation
Wilson, W.E. and Suh, H. H. (1997). Fine particles and coarse particles: Concentration relationships relevant to epidemiological studies. Journal of the Air & Waste Management Association, 47(12), 1238-1249.
Xing, Y. F., Xu, Y. H., Shi, M. H., & Lian, Y. X. (2016). The impact of PM2.5 on the human respiratory system. Journal of thoracic disease, 8(1), E69-74.


![Toni Kroos là ai? [ sự thật về tiểu sử đầy đủ Toni Kroos ]](https://evbn.org/wp-content/uploads/New-Project-6635-1671934592.jpg)


