
Network Latency: Definition, Causes, Measure and Resolve Issues
Mục Lục
What Is Network Latency?
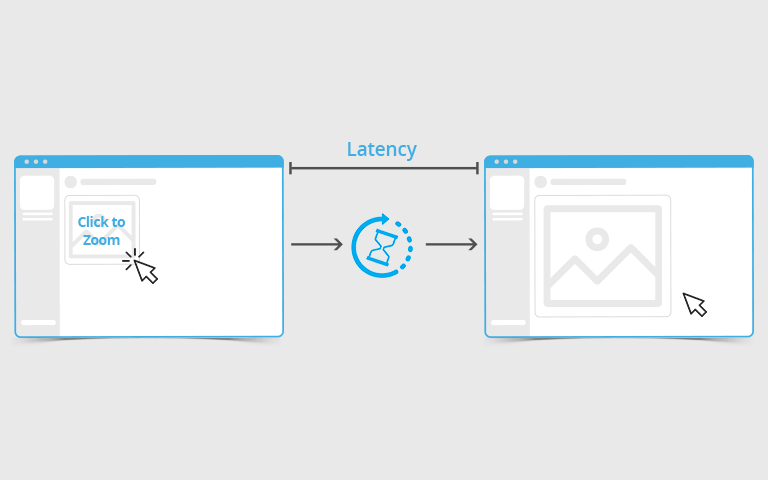
The latency of a network is the
time it takes for a data packet to be transferred from its source to the
destination. Also known as lag, network latency is generally measured in
milliseconds. Network latency tools measure the amount of time a data packet
takes as it’s transmitted and processed through various network devices until
it finally reaches its destination and gets decoded by the receiving machine.
An acceptable latency range will
depend on the network and the applications using the bandwidth on the network.
The bandwidth required by different applications on a network can vary
significantly. Applications like video or VoIP calls, require more bandwidth
and lower latency range to function efficiently. Whereas, other applications (e.g.,
email) may allow higher latency range. Network administrators need to take such
factors into account to allocate adequate resources and bandwidth and ensure
mission-critical operations of the company run smoothly.
The problem of high latency is
becoming more common as networks are growing bigger day by day. As the number
of nodes or resources in a network increase, networks get overburdened over a
period. Moreover, resolving network issues gets complicated as most businesses
today have remote offices, multiple applications, and cloud and virtualized
resources.
It may be noted that an
application may experience issues even when a network is working perfectly
fine. It’s not always easy to detect whether it’s a network latency or
application bug leading to application performance degradation. Modern network
latency tools can help IT teams deal with such issues with higher efficiency.
Possible Causes of Network
Latency
DNS Server Errors
A faulty DNS server can be a cause
of the poor performance of an application. Errors like 404’s and incorrect
pathways can prevent potential visitors to reach your website.
Poorly Optimized Backend Database
Over-utilized databases can slow
down your website severely. Also, higher table joins, complicated calculations,
presence of large tables with long fields, and improper use of indexes are some
of the common reasons for slow databases.
Low Memory Space
Low disk space is another reason system
performance can decrease. In case of low disk space, the operating system will
struggle and try to maintain RAM requirements being used by programs.
Selection of Transmission Mediums
Companies must carefully select
the transmission media as it directly affects the speed of a signal. In a
fiber-optic network, when an optical signal travels in a fiber link, latency
occurs at every stage. Latency keeps increasing during every conversion, right
from the time when the signal converts from electrical to optical domain, when
it goes through the fiber, and finally when it converts from optical to
electrical domain.
Multiple Routers
Routers take time to process the
information in the header of a packet. When a packet transfers from router to router,
the latency time gets increased.
How to Measure Latency?
Round Trip Time (RTT)
RTT is a common metric for latency
measurement. It’s the total time taken by a data packet as it travels from its
source to the destination and back. This time is also known as “round-trip
time” (or RTT). This method of evaluation has a few disadvantages as it might
not present a clear picture in cases when the return path is different.
Time to First Byte (TTFB)
Another metric for latency
calculations is known as “time to first byte” (or TTFB). TTFB records the
difference in time from the moment a data packet leaves a point on the network
to the time it takes to reach the destination.
Ping
Ping is another commonly used
latency testing method for the Internet Control Message Protocol (ICMP). The
Ping command is used by network admins to measure the time it takes for 32
bytes of data to reach its destination plus the time it takes to receive a
response in return. This command works on all operating systems with networking
capabilities.
Ping is good for quick
investigations. However, it doesn’t allow you to fix latency problems. It
doesn’t give adequate information if you’re trying to check multiple paths from
the same console. You’ll need additional network testing tools to get a clear
view of your network flow and bottlenecks.
How to Resolve Latency Issues?
As every network is designed for particular
workloads, network administrators have to keep track of any deviations or
spikes in their bandwidth consumption. Firewalls provide options to define user
groups and enforce bandwidth and QoS limits for different users in an
organization. QoS (Quality of Service) allows you to prioritize time-sensitive
application traffic over all other traffic. The method allows applications
requiring time-sensitive data such as audio/video playback or VoIP calls to get
prioritized bandwidth over other applications. Another solution is to implement
sophisticated traffic shaping methods like queuing algorithms to optimize
network traffic flow.
However, in complex networks, it isn’t easy to detect
the root cause of network latency related issues. Organizations employ a range
of network analysis and latency testing tools to reduce latency and manage
bandwidth in their networks. These tools offer packet sniffing, NetFlow
analysis, SNMP (Simple Network Management Protocol) monitoring, CBQoS (Class
Based Quality of Service) monitoring and other proprietary network analysis
features to help you keep track of network and resolve latency issues proactively.
Best Latency Testing Tool
There’s a wide variety of latency testing
tools available in the market to help you measure the latency and pinpoint
issues in the network. Tools like Paessler PRTG Network Monitor, ManageEngine
NetFlow Analyzer, and Ping Plotter may suit your organization’s network testing
requirements. However, based on user reviews, ease of usage, performance, and a
wide coverage of features for network monitoring and analysis, we find SolarWinds®
Network Performance Monitor is the best solution in the market.
SolarWinds
Network Performance Monitor (NPM)
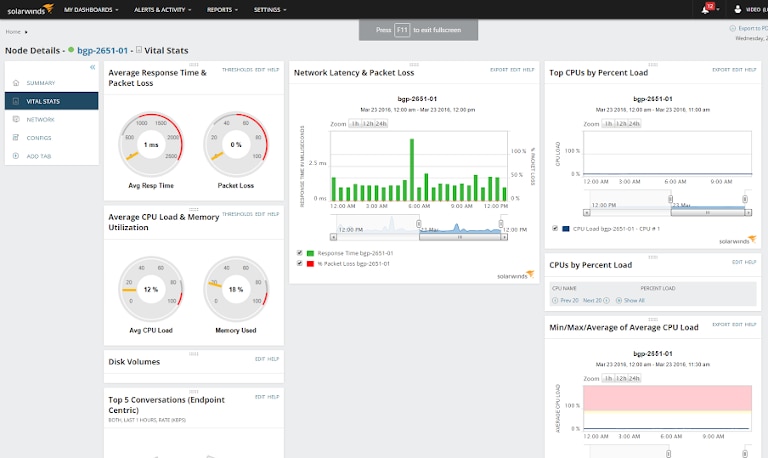
SolarWinds Network Performance Monitor helps you monitor all your network devices, physical and virtual servers, and applications using a single interface. SolarWinds proprietary NetPath feature enables visual analysis of a network with intelligent network maps. With these maps, you can track the flow of traffic between different nodes in your network. It also offers deep packet inspection. The feature helps you monitor response times and latency in a network over a Quality of Experience (QoS) dashboard. You can also use the network packet analyzer, which supports 1000-plus applications. This feature helps you to differentiate between network latency and application issues to identify what’s impacting application performance and user experience. Intelligent alerts and notifications along with a user-friendly dashboard, are some other major highlights of Network Performance Monitor. You can learn more about the product or sign up for a free trial for 30 days here.


![Toni Kroos là ai? [ sự thật về tiểu sử đầy đủ Toni Kroos ]](https://evbn.org/wp-content/uploads/New-Project-6635-1671934592.jpg)


