
How does U.S. life expectancy compare to other countries? – Peterson-KFF Health System Tracker
Mục Lục
Stay Connected
Get the best of the Health System Tracker delivered to your inbox.
Get the best of the Health System Tracker delivered to your inbox.
In 1980, life expectancy at birth in the U.S. and in comparably large and wealthy countries was similar, but over recent decades, life expectancy has improved by much more in peer nations than it has in the U.S. The COVID-19 pandemic has increased mortality and premature death rates in the U.S. by more than it did in most peer countries, widening a gap that already existed before the pandemic.
This chart collection examines how life expectancy in the U.S. compares to that of other similarly large and wealthy countries in the Organisation for Economic Co-operation and Development (OECD). Using provisional 2021 estimates, we also assess how the COVID-19 pandemic has affected life expectancy in the U.S. compared to peer countries.
We find life expectancy in the U.S. fell by 2.7 years from 2019 to 2021, whereas in peer countries’ life expectancies fell by an average of just 0.2 years in this period. COVID-19 has erased two decades of life expectancy growth in the U.S., whereas the average life expectancy for comparable countries has decreased only marginally, to 2018 levels.
The U.S. has the lowest life expectancy among large, wealthy countries while it far outspends its peers on healthcare Click To Tweet
From 2020 to 2021, life expectancy continued to decline in the U.S. while rebounding in most comparable countries
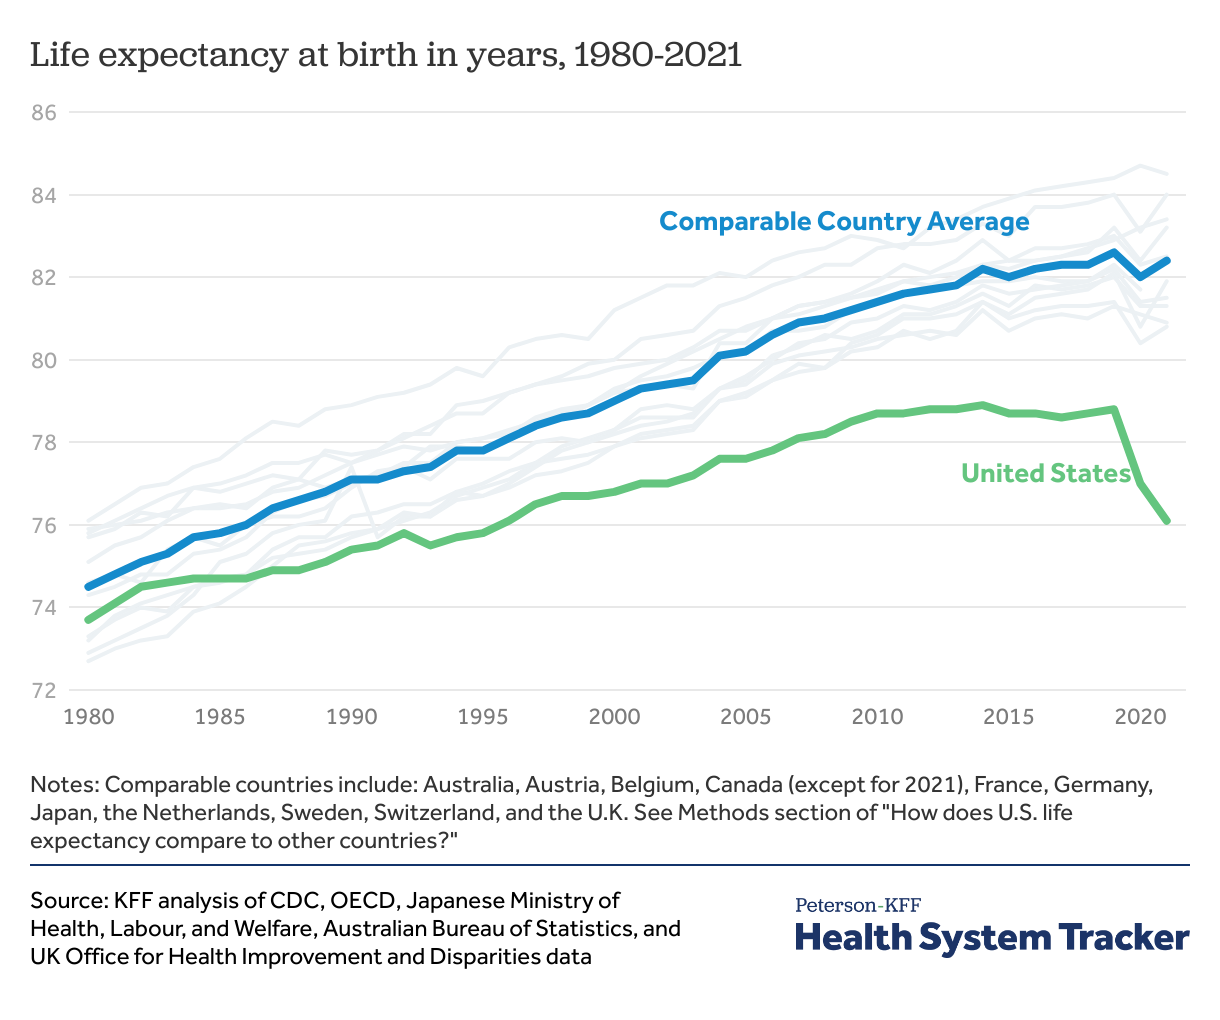
Life expectancy in the U.S. and peer countries generally increased from 1980-2019, but decreased in most countries in 2020 due to COVID-19. From 2020 to 2021, life expectancy at birth began to rebound in most comparable countries while it continued to decline in the U.S. The CDC estimates life expectancy at birth in the U.S. decreased to 76.1 years in 2021, down 2.7 years from 78.8 years in 2019 and down 0.9 years from 2020. The average life expectancy at birth among comparable countries was 82.4 years in 2021, down 0.2 years from 2019 and up 0.4 years from 2020. (Note: 2021 life expectancy estimates for Canada are not yet available and therefore excluded in the comparable country average for 2021.)
The life expectancy data presented here are period life expectancy estimates based on excess mortality observed in each year. Period life expectancy at birth represents the mortality experience of a hypothetical cohort if current conditions persisted into the future and not the mortality experience of a birth cohort.
Related Content:
The state of the U.S. health system in 2022 and the outlook for 2023
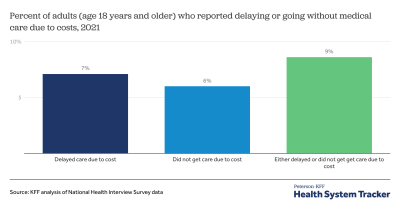
How does cost affect access to healthcare?
The U.S. has the lowest life expectancy at birth for both women and men
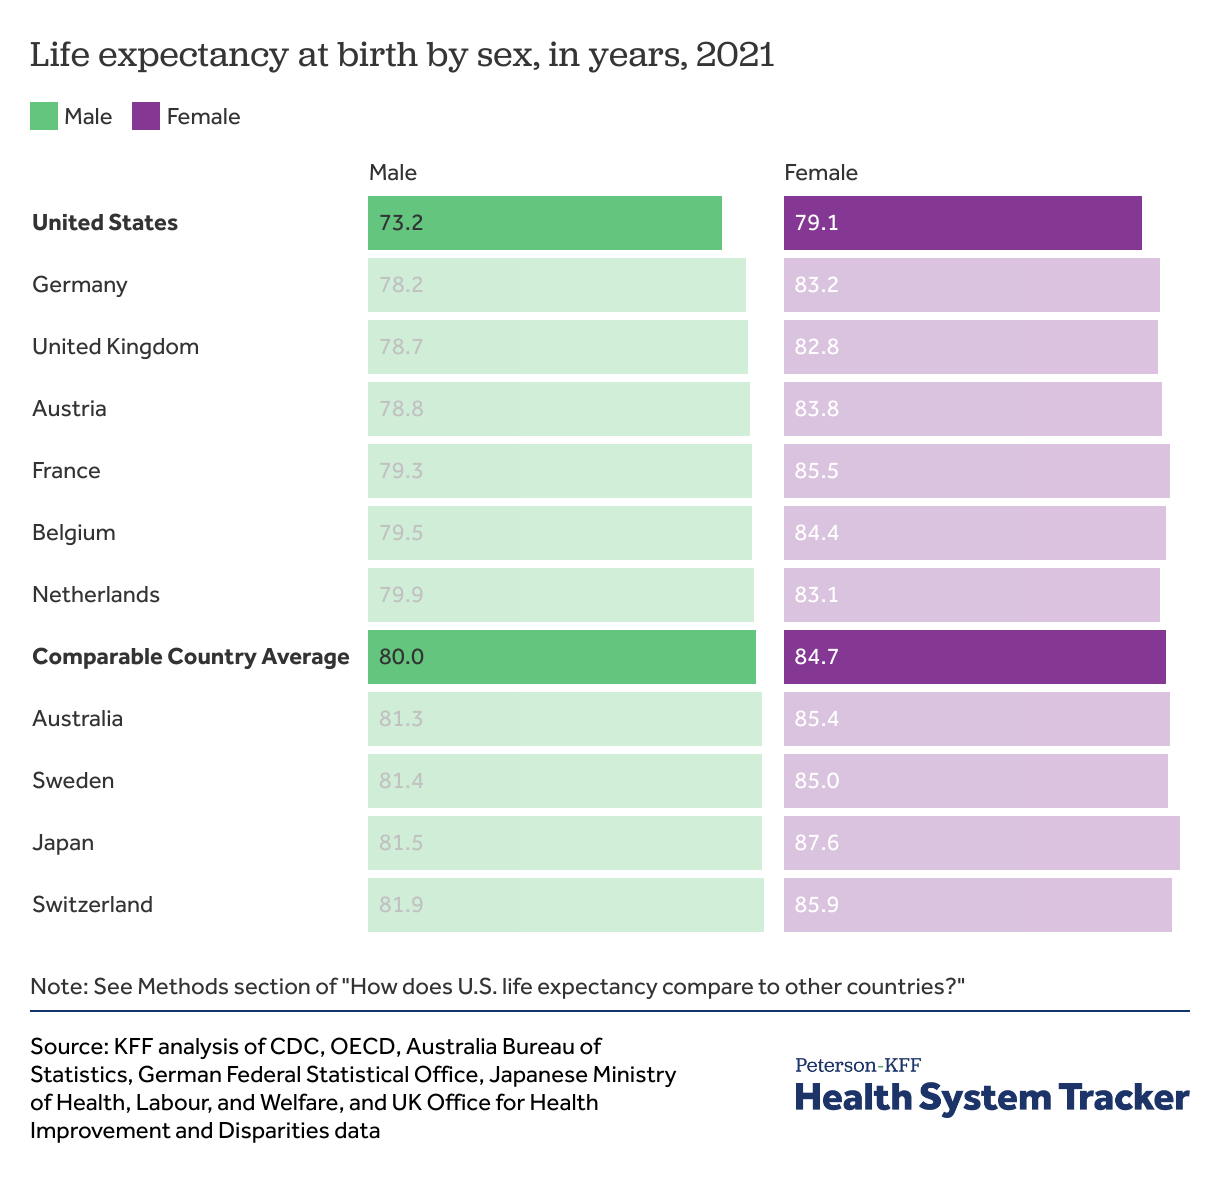
In the U.S. and all other comparable countries, women tend to live longer than men. However, the U.S. ranks lowest in life expectancy for both men and women among countries with high GDP per capita.
The life expectancy gap between men and women has widened more in the U.S. than in comparable countries
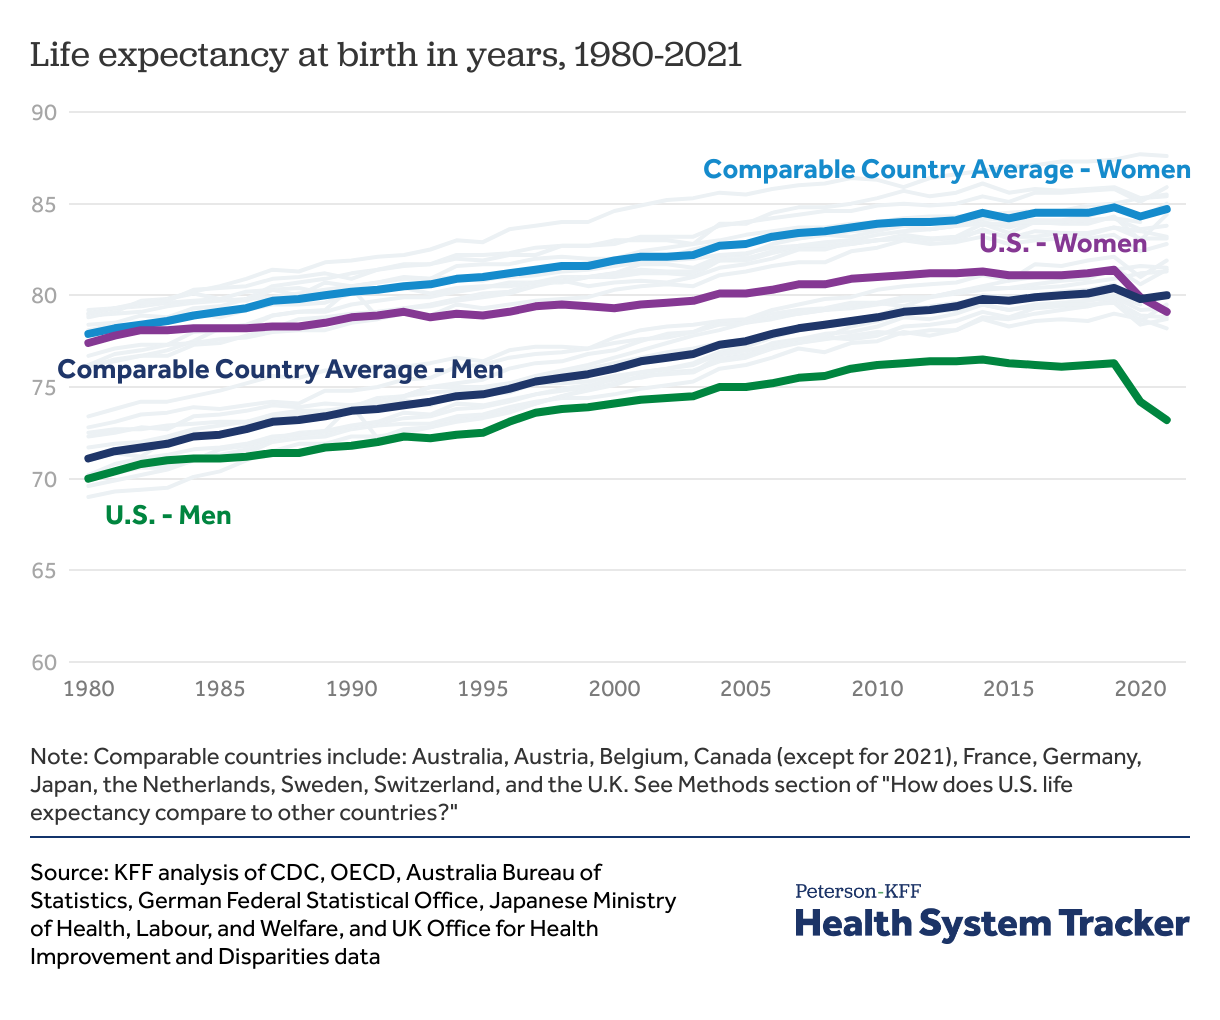
In 2021 over the previous year, life expectancy at birth for men decreased by 1.0 year in the U.S. but increased by about 0.2 years in comparable countries, on average. Life expectancy at birth decreased by 0.8 years for women in the U.S. and increased by about 0.4 years in comparable countries, on average.
Before the COVID-19 pandemic, the U.S. experienced less rapid increases in life expectancy for both men and women than comparable countries, on average. In recent years, the difference in life expectancy between women and men in the U.S. has surpassed the average in comparable countries since 2013. In 2019, life expectancy differences between women and men were 5.1 years in the United States and 4.3 years in comparable countries. This difference increased to 5.9 years in 2021 in the U.S. and 4.6 years in comparable countries due to COVID-19.
The disparity in life expectancy between the U.S. and peer countries persists at older ages
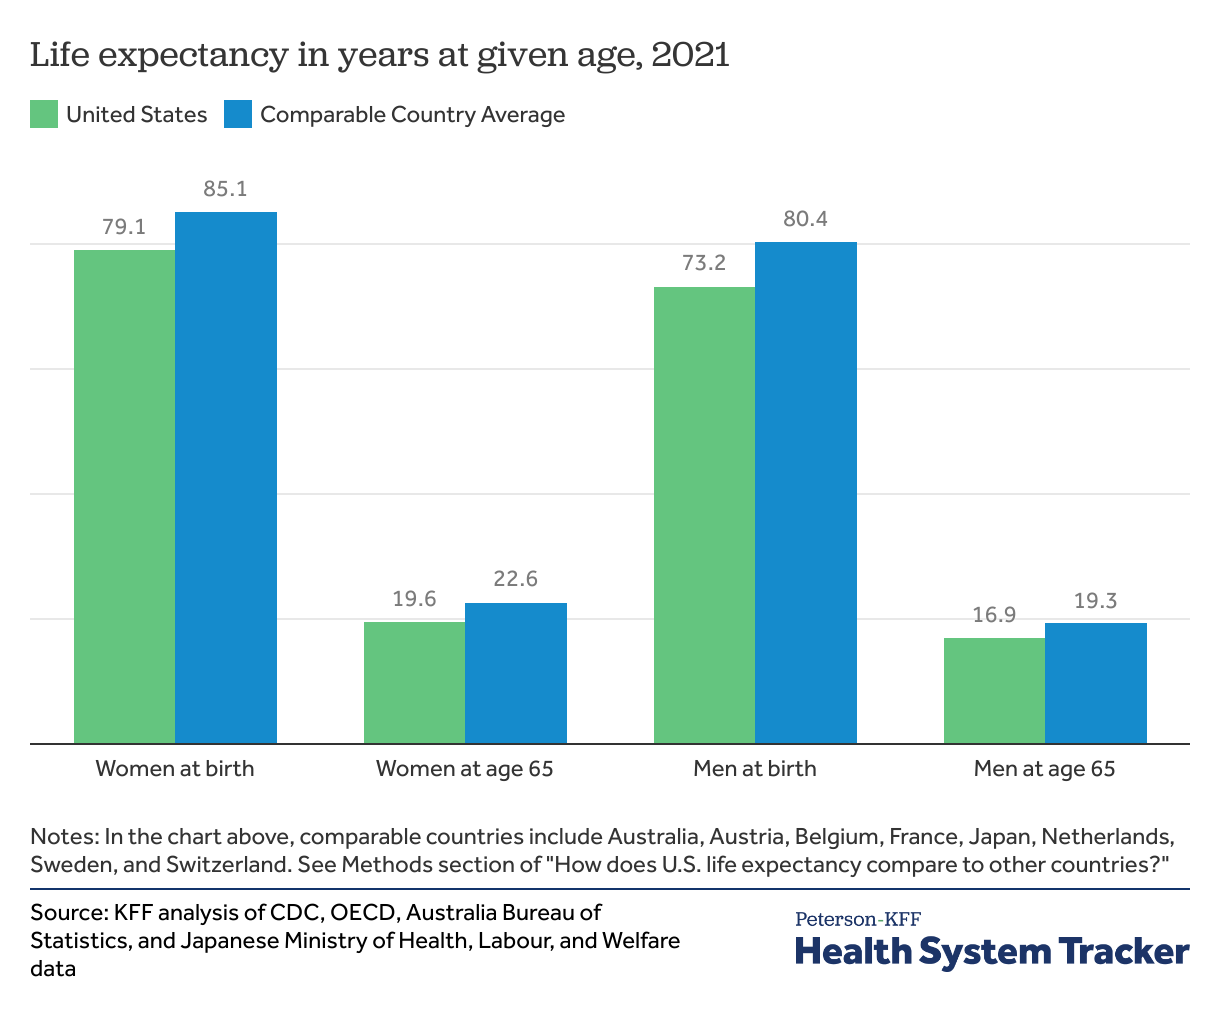
Since most people start to interact with the healthcare system more regularly as they get older, measuring life expectancy at older ages may provide a better sense of how well the health system performs (though it is still influenced by how healthy people are when they reach older ages). The disparity between the U.S. and comparable countries continues at older ages and becomes more pronounced as a share of overall life expectancy as people get older.
In 2021, comparable country average life expectancy exceeded life expectancy in the U.S. by 7.6% at birth to 15.3% at age 65 for women and from 9.8% at birth to 14.2% at age 65 for men.
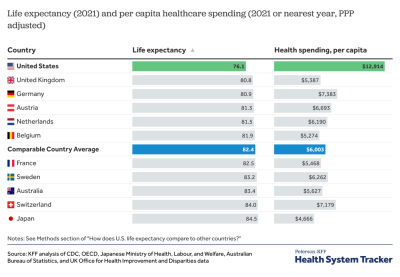
The U.S. has the lowest life expectancy among large, wealthy countries while it far outspends its peers on healthcare
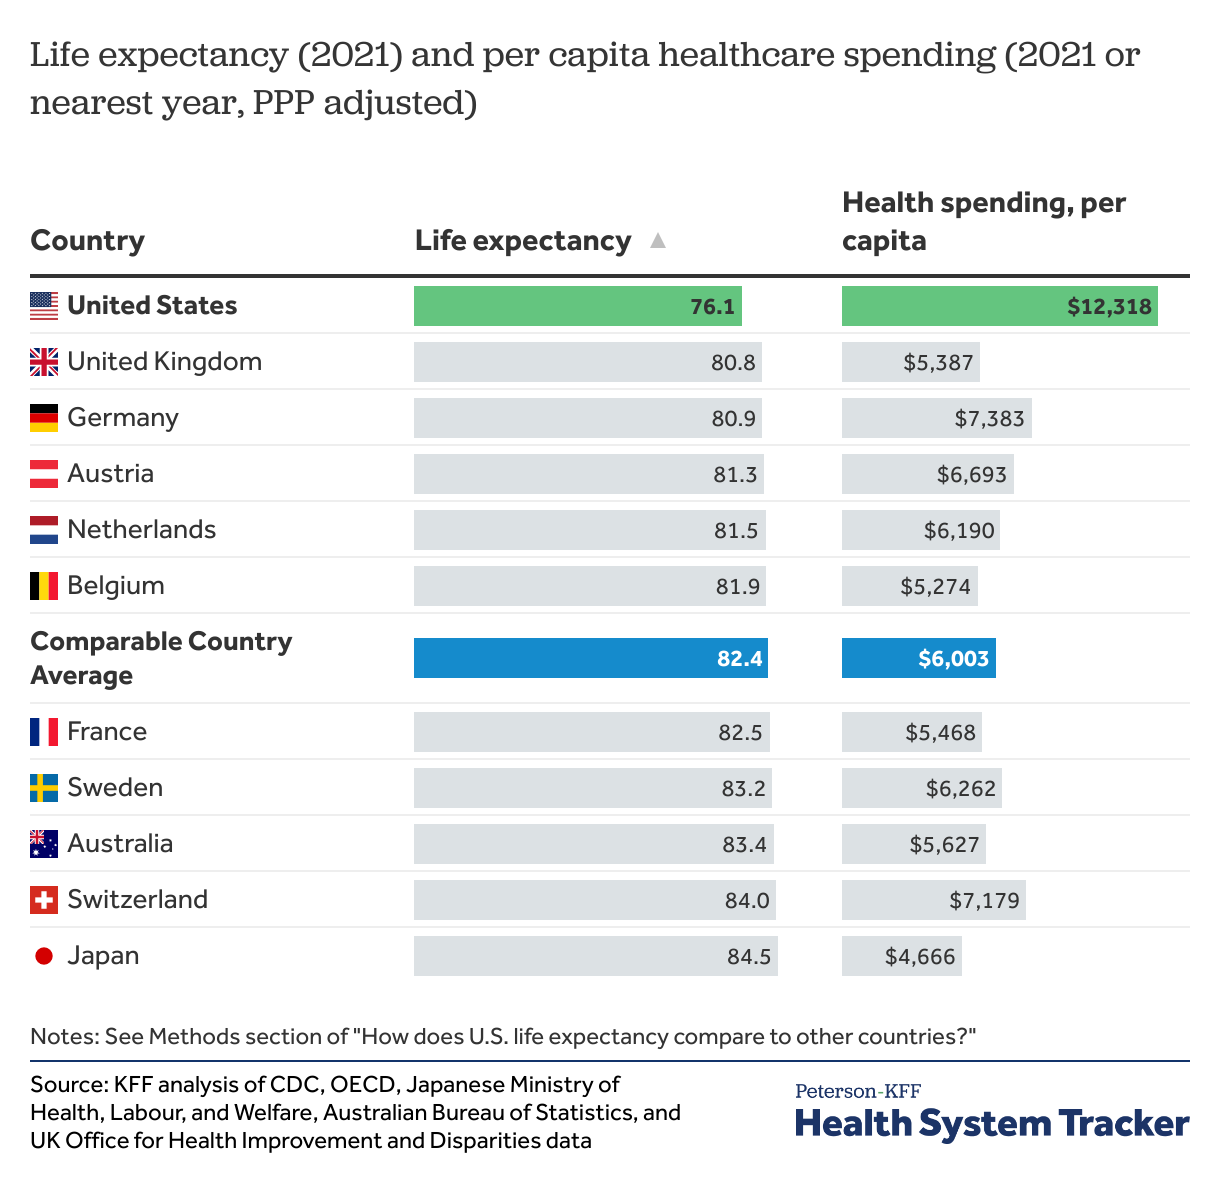
On a per person basis, U.S. health spending is about double that of similarly large and wealthy nations. In 2021, the U.S. spent over $4,000 more per capita on healthcare than the next highest spending country. Meanwhile, the U.S. has the lowest life expectancy among peer countries.
In 1980, the U.S. and comparable countries had similar life expectancies and health spending, but the trends have diverged in the last few decades
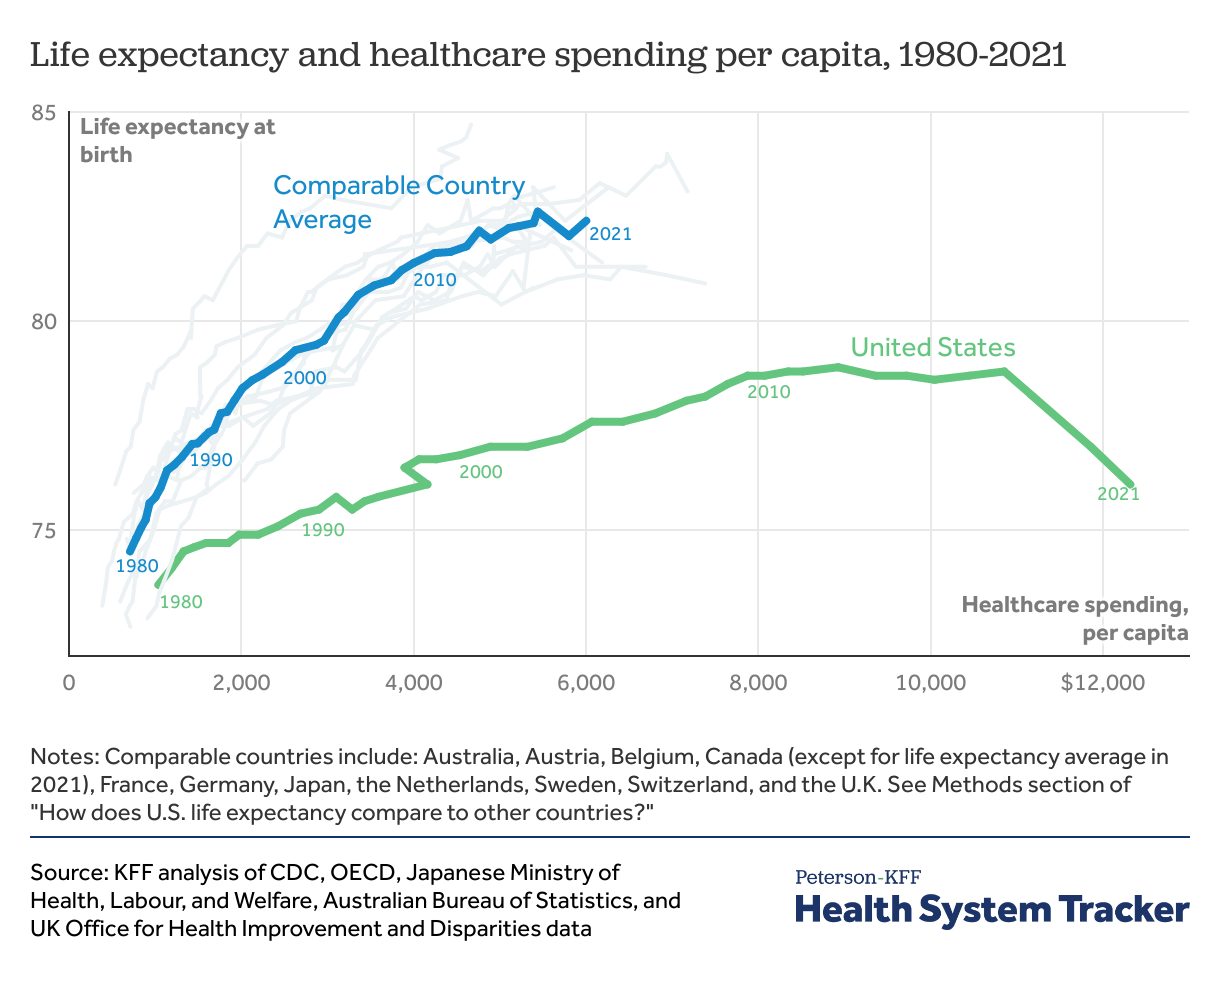
Among peer nations, the U.S. has the highest per person healthcare spending, reaching an estimated $12,318 per capita in 2021 based on OECD data. However, the higher spending on healthcare in the U.S. does not translate into longer lifespans. Back in 1980, life expectancy and per capita healthcare spending in the U.S. were similar to those in comparison countries. However, recently healthcare spending has grown faster in the U.S. than in its peers, while life expectancy has grown slower in the U.S. than in peer countries.
In 2020, the U.S., which substantially outspent its peers, had the lowest life expectancy, and Japan, the country with the lowest per person health spending, had the highest life expectancy among similarly large and wealthy nations.
Methods
Life expectancy data in this analysis were gathered from the CDC, the OECD, the Japanese Ministry of Health, Labour, and Welfare, the Australian Bureau of Statistics, and the UK Office for Health Improvement and Disparities. Some life expectancy data for 2021 are estimates or provisional. For 2021 United Kingdom data, life expectancy data for England were used. 2021 data for Canada were unavailable and therefore excluded from the 2021 comparable country average. 2021 values for Australia, Japan, and the United Kingdom are averages of life expectancy estimates for males and females. Number on charts may not average to the comparable country average due to rounding. OECD data have a break in series for Canada in 1982, Germany in 1991, Switzerland and Belgium in 2011, and France in 2013. Comparable country average life expectancy in the chart “Life expectancy in years at given age, 2021” excludes the UK, Germany, and Canada, as data were not available for these nations for all ages. For health spending data, the 1991 data point for Germany is unavailable; from 1980-1990, health spending data in France is only available for 1980, 1985, and 1990. Therefore, data for France is only shown from 1990 onward. For comparable country average health spending in 2021, we used 2020 data points for the following countries due to missing 2021 data: Australia, Belgium, France, Japan, Netherlands, and Switzerland.
About this site
The Peterson Center on Healthcare and KFF are partnering to monitor how well the U.S. healthcare system is performing in terms of quality and cost.

![]()


![Toni Kroos là ai? [ sự thật về tiểu sử đầy đủ Toni Kroos ]](https://evbn.org/wp-content/uploads/New-Project-6635-1671934592.jpg)


