
Global Smartphone Market Share: Q1 2021 to Q4 2022
Mục Lục
Global Smartphone Shipments Market Data (Q1 2021 – Q4 2022)
Published Date: February 8, 2023
A repository of quarterly data for the global smartphone market. This data is a part of a series of reports which track the mobile handset market: Smartphone and Feature Phone shipments every quarter for more than 140 brands covering more than 95% of the total device shipments in the industry.
 Source: Market Monitor Service
DOWNLOAD:
![]()
![]()
Global Smartphone Shipments Market Share (%)
Brands
Q1
2021
Q2
2021
Q3
2021
Q4
2021
Q1
2022
Q2
2022
Q3
2022
Q4
2022
Apple
17%
15%
14%
22%
18%
16%
16%
23%
Samsung
22%
18%
20%
19%
23%
21%
21%
19%
Xiaomi
14%
16%
13%
12%
12%
13%
13%
11%
OPPO*
11%
10%
11%
9%
9%
10%
10%
10%
vivo
10%
10%
10%
8%
8%
9%
9%
8%
Others
26%
31%
32%
30%
30%
31%
31%
29%
Global Smartphone Shipments (in Millions)
Brands
Q1
2021
Q2
2021
Q3
2021
Q4
2021
Q1
2022
Q2
2022
Q3
2022
Q4
2022
Apple
59.5
48.9
48.0
81.5
59.0
46.5
49.2
70.0
Samsung
76.6
57.6
69.3
69.0
74.5
62.5
64.3
58.3
Xiaomi
48.5
52.5
44.4
45.0
39.0
39.5
40.5
33.2
OPPO*
38
33.6
38.1
33.9
30.9
28.2
29.5
29.6
vivo
35.5
32.5
33.7
29.3
24.8
25.5
26.0
23.4
Others
96.8
98.0
108.5
112.7
98.1
92.3
92.4
89.4
Total Market
354.9
323.1
342.0
371.4
326.4
294.5
301.9
303.9
*OPPO includes OnePlus since Q3 2021
**Ranking is according to the latest quarter.
Highlights:
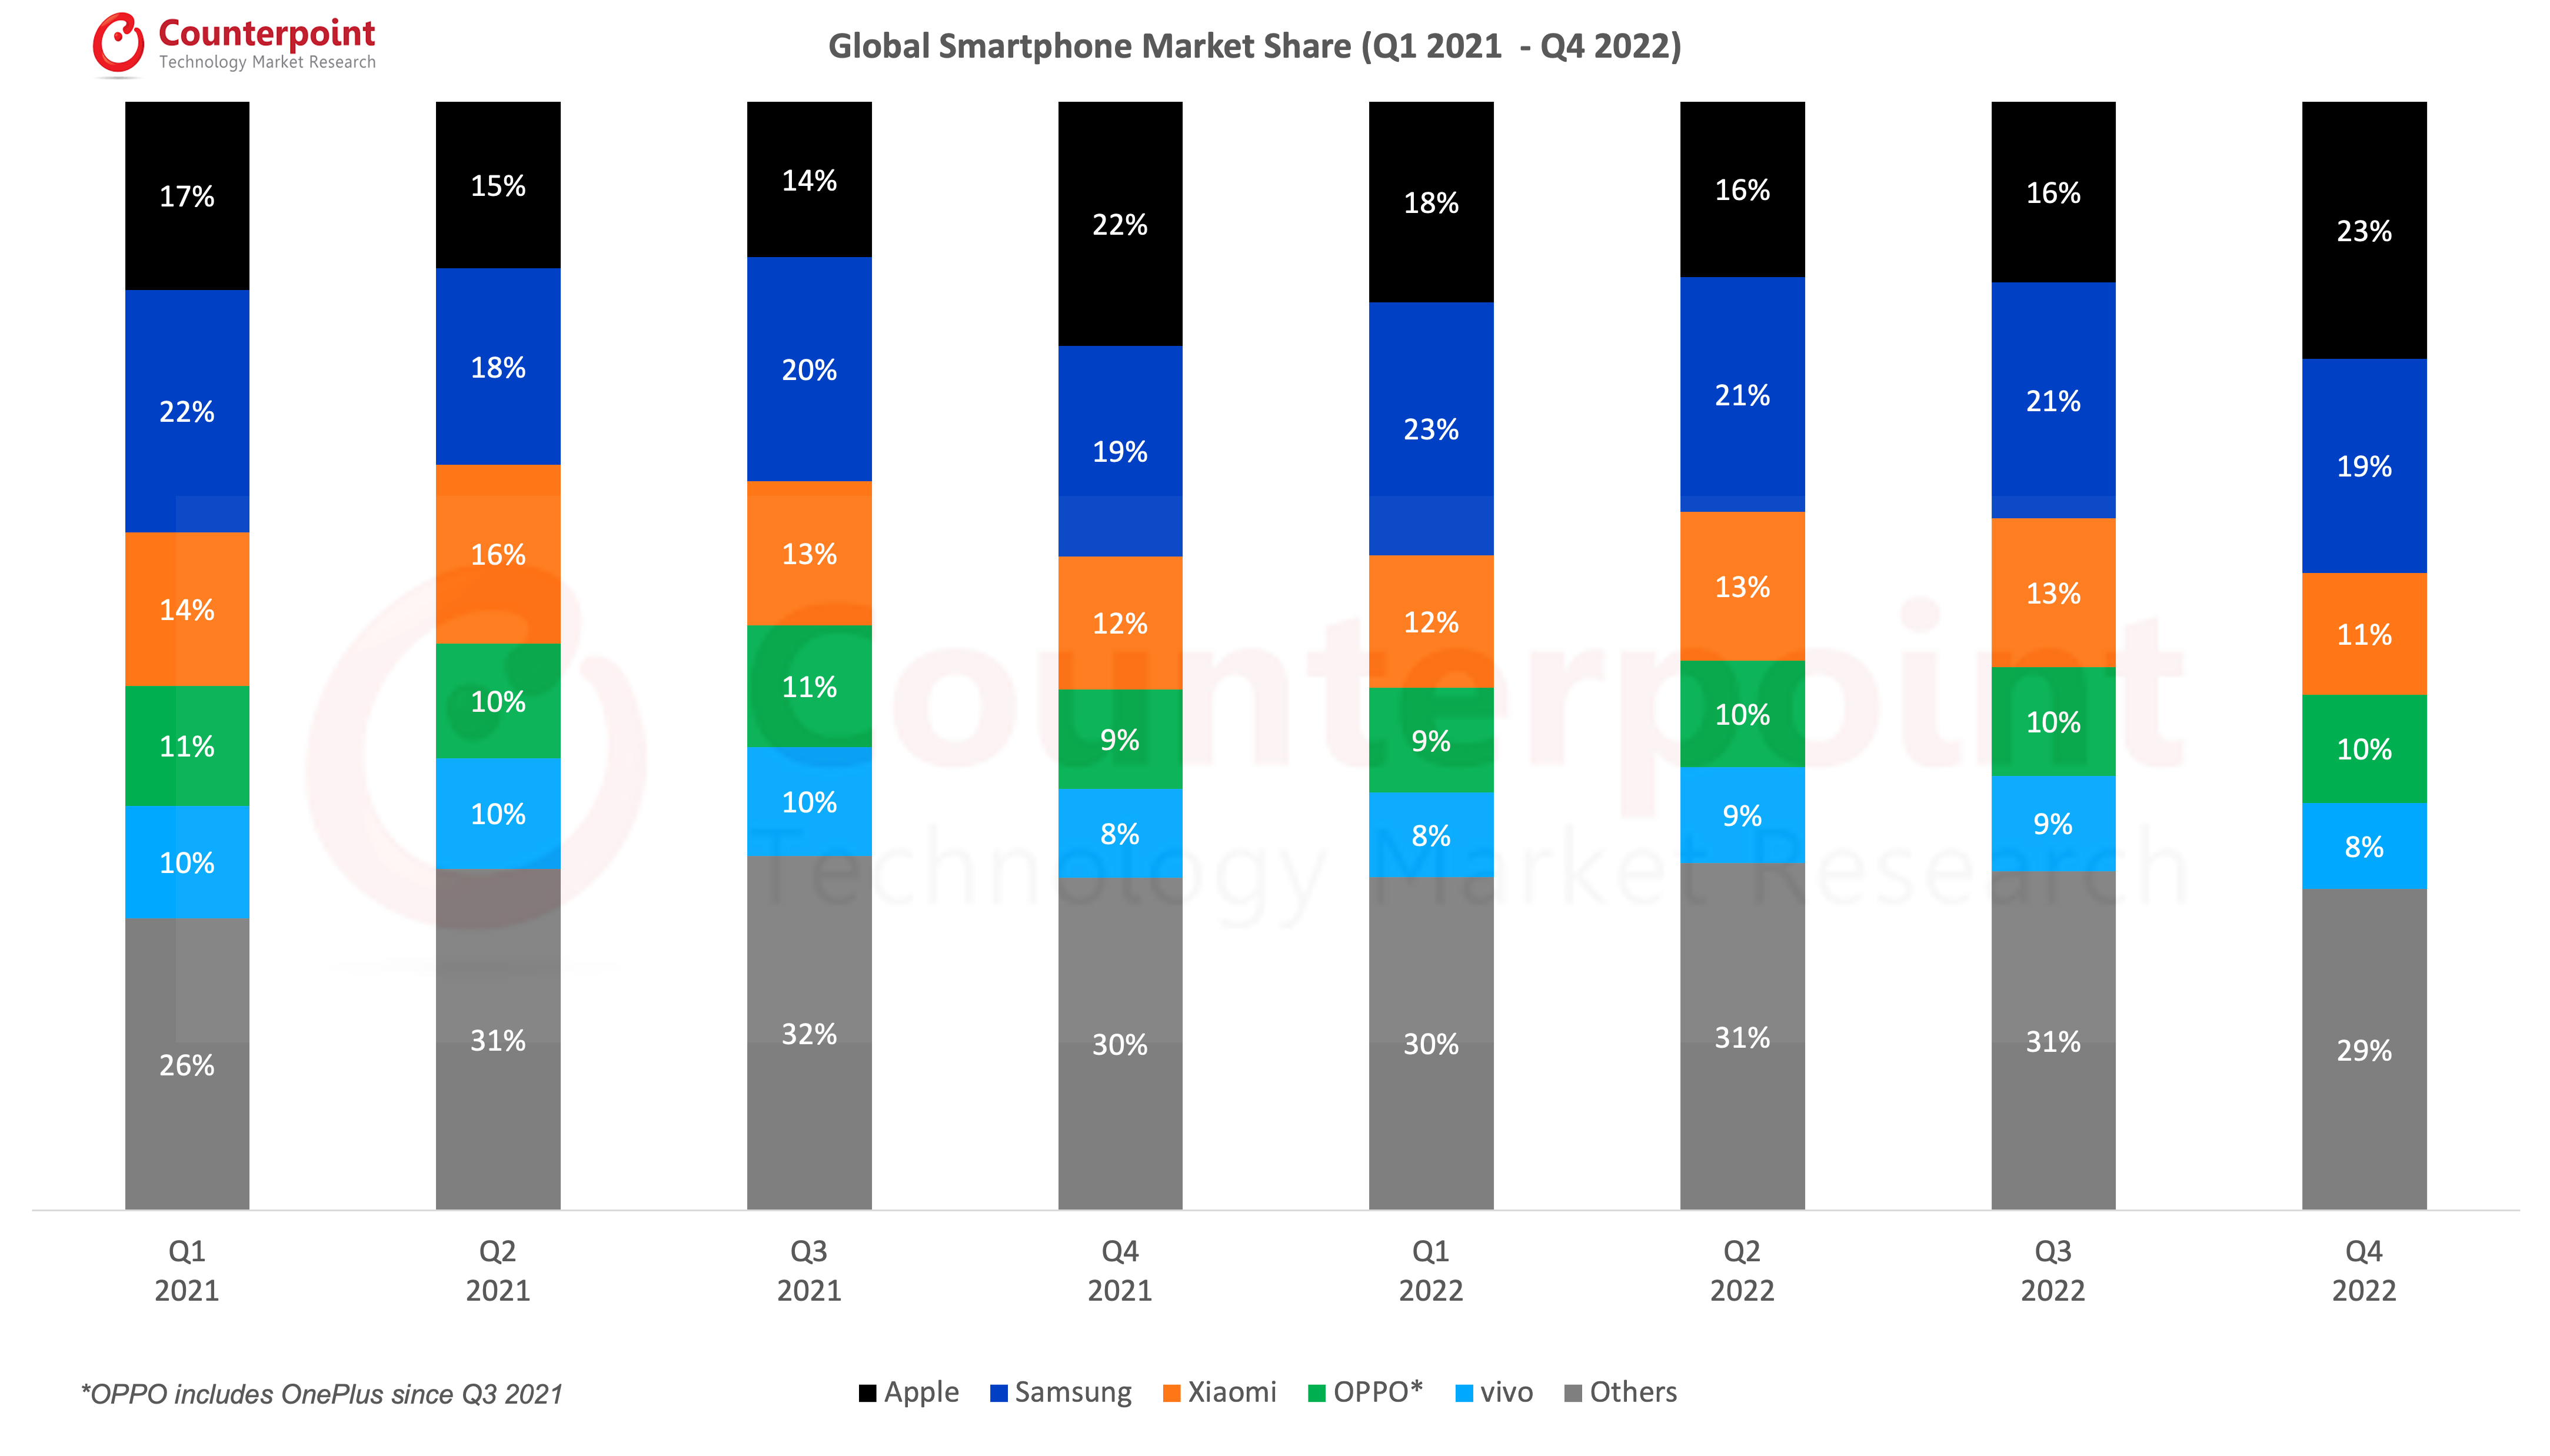
- The global smartphone market declined by 18% YoY to reach 304 million units in Q4 2022.
- Apple replaced Samsung as the top smartphone player in Q4 2022, driven by the recent launch of the iPhone 14 series.
- Apple market share for Q4 2022 was 23% followed by Samsung market share of 19%.
- The 2022 global smartphone shipments declined by 12% to 1.2 billion units, the lowest since 2013.
- Global smartphone revenues declined by 9% to $409 billion, the lowest since 2017.
- Apple achieved its highest-ever global smartphone shipment, revenue and operating profit share in 2022.
For our detailed research on the global smartphone market in Q4 2022, click here.
The global smartphone market share numbers are from:
Related Posts:


*Data on this page is updated every quarter
This data represents the global smartphone market share by quarter (from 2020-2022) by top OEMs. Global smartphone shipments by market share and millions of units are provided.
For detailed insights on the data, please reach out to us at sales(at)counterpointresearch.com. If you are a member of the press, please contact us at press(at)counterpointresearch.com for any media enquiries.
Frequently asked question (FAQs):
• What’s the global market size for smartphones?
The global smartphone market shipments declined to reach 304 million units in Q4 2022.
• What is the global market for mobile phones?
The 2022 global smartphone shipments declined to 1.2 billion units, the lowest since 2013.
• Who dominates the smartphone market?
Apple dominated the smartphone market in 2022 by achieving its highest-ever global shipments, revenue and operating profit share.
• How fast is the smartphone market growing?
The global smartphone shipments declined by 12% in 2022.
Q3 2022 Highlights
Published Date: December 20, 2022
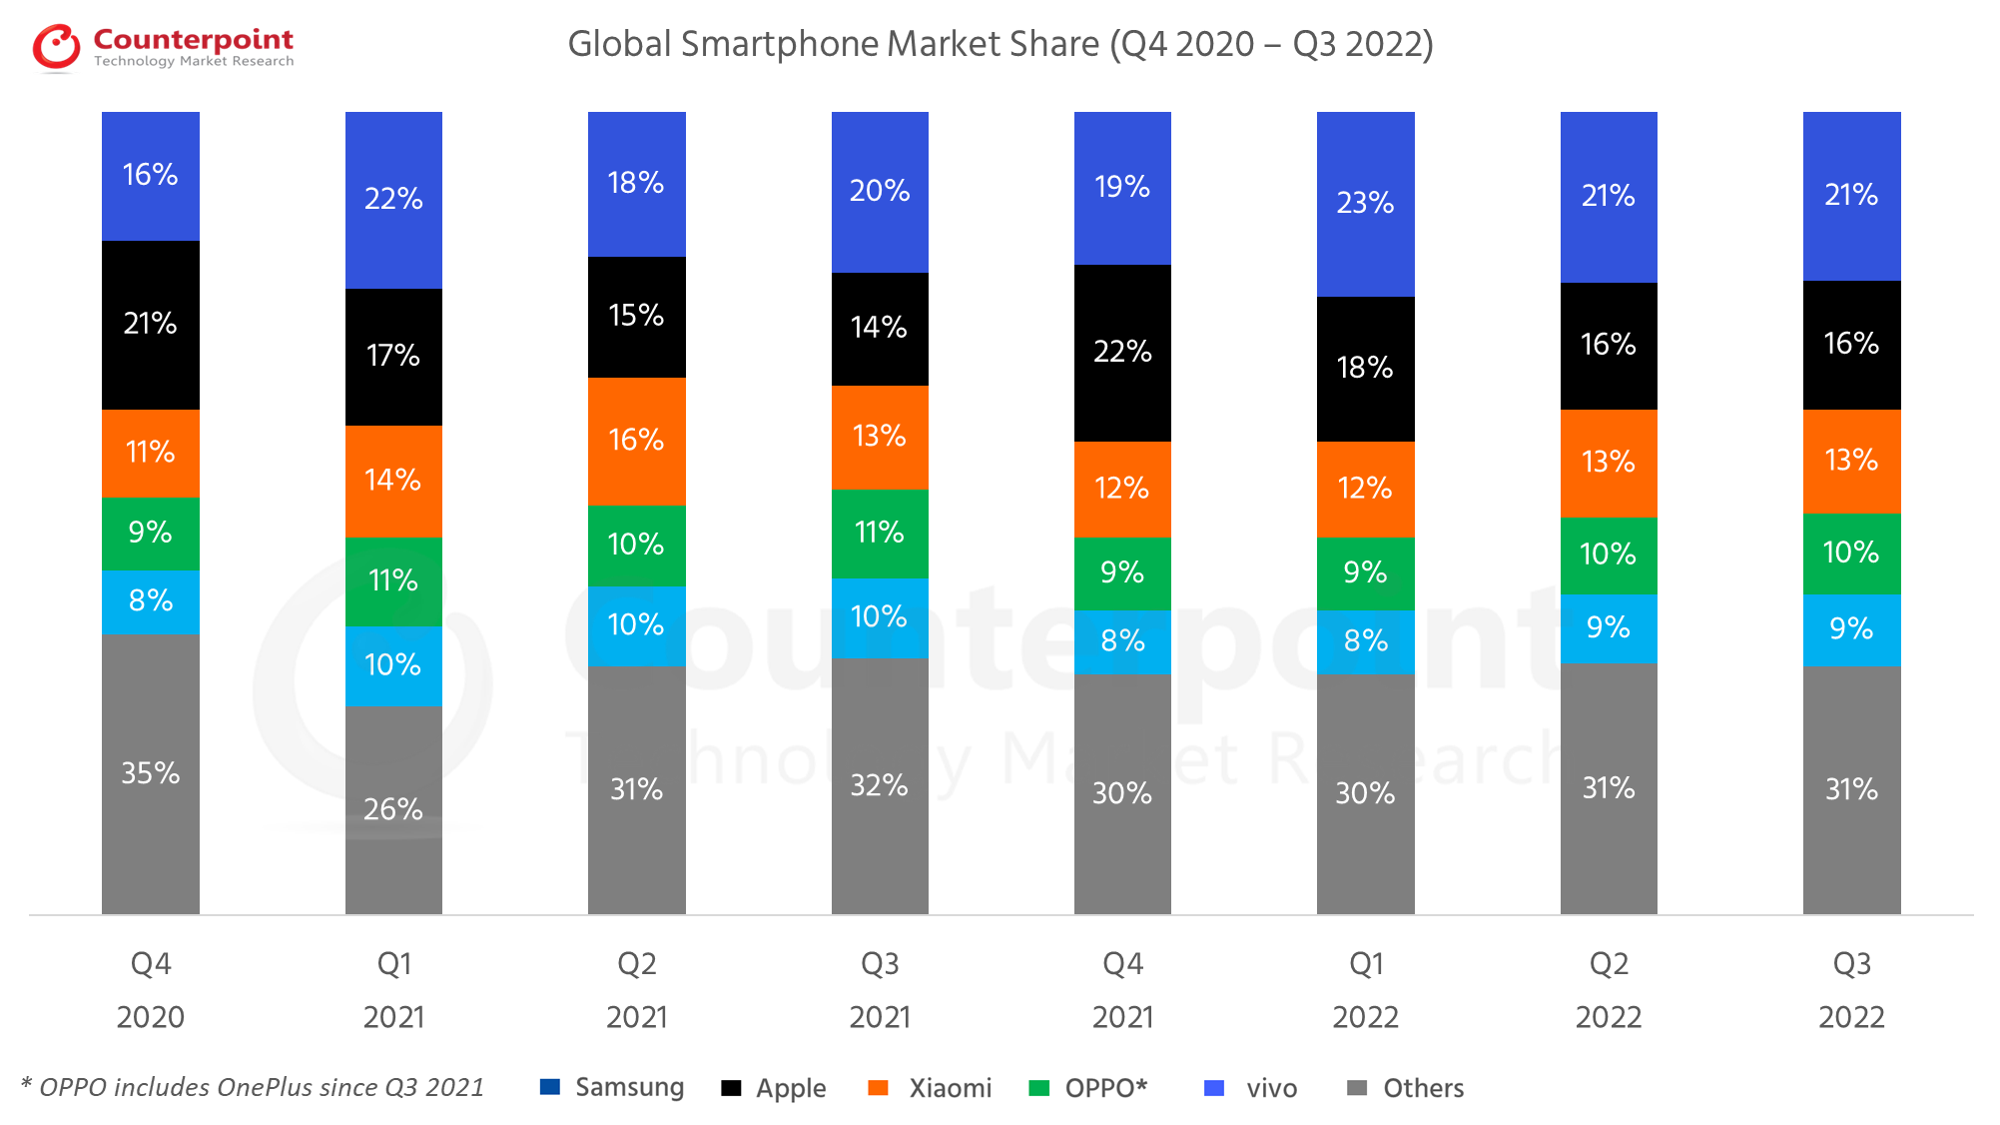
- The global smartphone market declined by 12% YoY even as it grew by 2% QoQ to reach 301 million units in Q3 2022.
- While quarterly growth in Apple and Samsung pushed the global smartphone market above 300 million units, a level it failed to reach last quarter, political and economic instability drove negative consumer sentiment.
- Apple was the only top-five smartphone brand to grow YoY, with shipments increasing 2% YoY, growing market share by two percentage points to 16%.
- Samsung’s shipments declined by 8% YoY but grew 5% QoQ to 64 million.
- Xiaomi, OPPO* and vivo, recovered slightly after receiving heavy beatings due to lockdowns in China in Q2, and as they captured more of the market ceded by Apple and Samsung’s exit from Russia.
Global Smartphone Shipments Market Share (%)
Brands
Q4
2020
Q1
2021
Q2
2021
Q3
2021
Q4
2021
Q1
2022
Q2
2022
Q3
2022
Samsung
16%
22%
18%
20%
19%
23%
21%
21%
Apple
21%
17%
15%
14%
22%
18%
16%
16%
Xiaomi
11%
14%
16%
13%
12%
12%
13%
13%
OPPO*
9%
11%
10%
11%
9%
9%
10%
10%
vivo
8%
10%
10%
10%
8%
8%
9%
9%
Others
35%
26%
31%
32%
30%
30%
31%
31%
Global Smartphone Shipments (in Millions)
Brands
Q4
2020
Q1
2021
Q2
2021
Q3
2021
Q4
2021
Q1
2022
Q2
2022
Q3
2022
Samsung
62.5
76.6
57.6
69.3
69.0
74.5
62.5
64.3
Apple
81.9
59.5
48.9
48.0
81.5
59.0
46.5
49.2
Xiaomi
43.0
48.5
52.5
44.4
45.0
39.0
39.5
40.5
OPPO*
34.0
38
33.6
38.1
33.9
30.9
28.2
29.5
vivo
33.4
35.5
32.5
33.7
29.3
24.8
25.2
26.0
Others
139.8
96.8
98.0
108.5
112.7
98.1
92.3
92.4
Total Market
394.6
354.9
323.1
342.0
371.4
326.4
294.5
301.9
*OPPO includes OnePlus since Q3 2021
**Ranking is according to the latest quarter.
Q2 2022 Highlights
Published Date: August 16, 2022
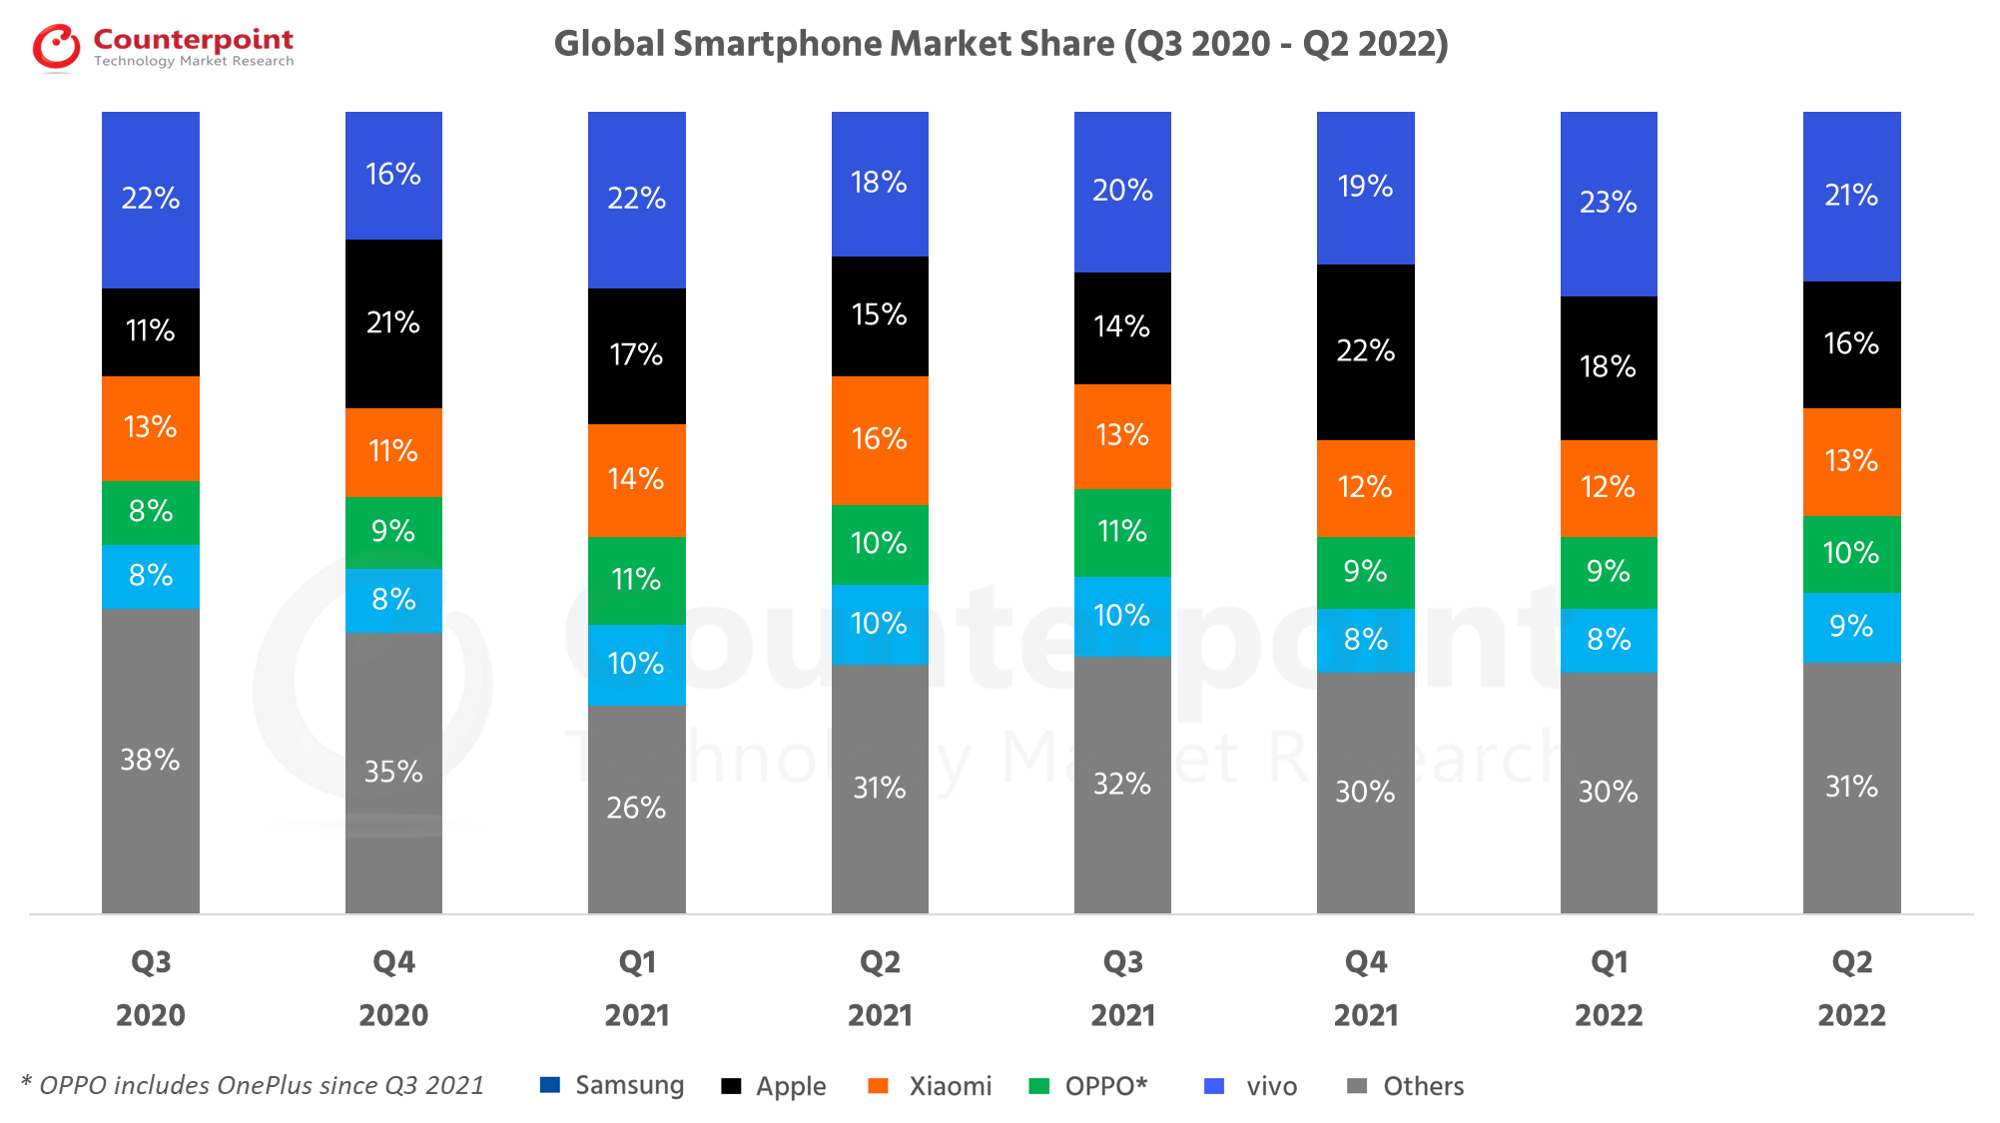
• The global smartphone market growth saw a decline of 9% YoY and 10% QoQ to 294.5 million units in Q2 2022.
• Global smartphone market share carries on consolidation, with top three brands commanding 50% share for three consecutive quarters.
• This was the first time quarterly shipments dropped below 300 million units since Q2 2020 during the early part of the COVID-19 pandemic.
• Samsung was the only top-five smartphone brand to grow YoY, increasing shipments by 8% YoY and growing market share by three percentage points to 21%.
• Apple market share declined by 5% YoY in Q2 2022, although its share increased in a diminished market.
• iPhone shipment market share continues to edge upwards, with Apple reaching its highest Q2 2022 shipment share ever
• The Android vs iOS market share battle, traditionally contested by Apple in the US, Europe and Japan, is intensifying in markets like China, which is becoming a significant driver of iOS installed based globally.
• Xiaomi, OPPO* and vivo, hit by China lockdowns, suffered double digit YoY declines in their respective shipments.
Global Smartphone Shipments Market Share (%)
Brands
Q3
2020
Q4
2020
Q1
2021
Q2
2021
Q3
2021
Q4
2021
Q1
2022
Q2
2022
Samsung
22%
16%
22%
18%
20%
19%
23%
21%
Apple
11%
21%
17%
15%
14%
22%
18%
16%
Xiaomi
13%
11%
14%
16%
13%
12%
12%
13%
OPPO*
8%
9%
11%
10%
11%
9%
9%
10%
vivo
8%
8%
10%
10%
10%
8%
8%
9%
Others
38%
35%
26%
31%
32%
30%
30%
31%
Global Smartphone Shipments (in Millions)
Brands
Q3
2020
Q4
2020
Q1
2021
Q2
2021
Q3
2021
Q4
2021
Q1
2022
Q2
2022
Samsung
80.4
62.5
76.6
57.6
69.3
69.0
74.5
62.5
Apple
41.7
81.9
59.5
48.9
48.0
81.5
59.0
46.5
Xiaomi
46.5
43.0
48.5
52.5
44.4
45.0
39.0
39.5
OPPO*
31.0
34.0
38.0
33.6
38.1
33.9
30.9
28.2
vivo
31.0
33.4
35.5
32.5
33.7
29.3
24.8
25.5
Others
135.0
139.8
96.8
98.0
108.5
112.7
98.2
92.3
Total Market
365.6
394.6
354.9
323.1
342.0
371.4
326.4
294.5
*OPPO includes OnePlus since Q3 2021
**Ranking is according to the latest quarter.
Q1 2022 Highlights
Published Date: May 16, 2022
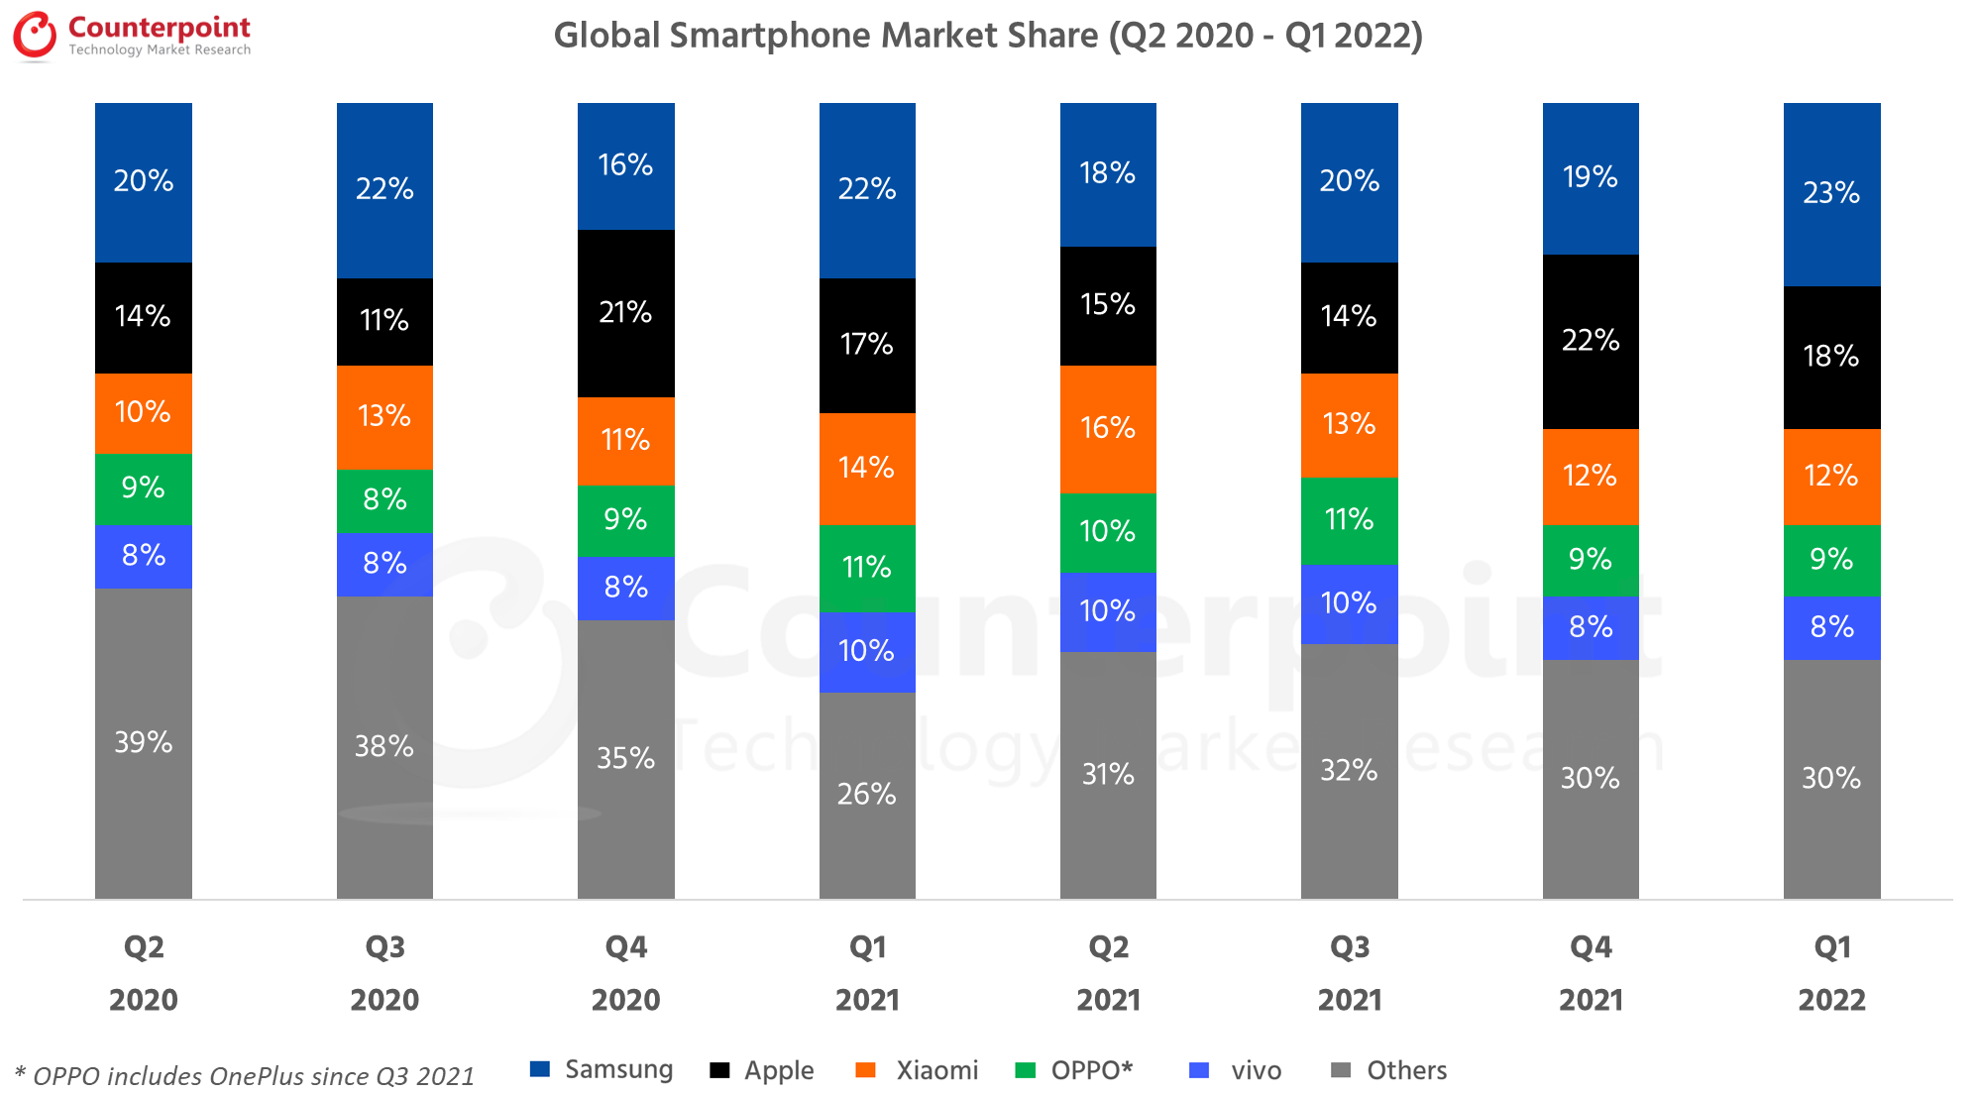
• The global smartphone market declined by 7% YoY and 12% QoQ to 328 million units in Q1 2022.
• While Samsung’s shipments declined 3% YoY, it was the only top-five smartphone brand to grow QoQ. Its market share rose to 23% from 19% last quarter, resulting in Samsung taking the top spot from Apple in Q1 2022.
• Apple’s shipments declined by 1% annually to reach 59 million units in Q1 2022. This was after an expected seasonal quarterly shipment decline of 28%.
• Xiaomi, OPPO* and vivo’s component struggles continued, causing a quarterly and annual decline in their respective shipments.
Global Smartphone Shipments Market Share (%)
Brands
Q2
2020
Q3
2020
Q4
2020
Q1
2021
Q2
2021
Q3
2021
Q4
2021
Q1
2022
Samsung
20%
22%
16%
22%
18%
20%
19%
23%
Apple
14%
11%
21%
17%
15%
14%
22%
18%
Xiaomi
10%
13%
11%
14%
16%
13%
12%
12%
OPPO*
9%
8%
9%
11%
10%
11%
9%
9%
vivo
8%
8%
8%
10%
10%
10%
8%
8%
Others
39%
38%
35%
26%
31%
32%
30%
30%
Global Smartphone Shipments (in Millions)
Brands
Q2
2020
Q3
2020
Q4
2020
Q1
2021
Q2
2021
Q3
2021
Q4
2021
Q1
2022
Samsung
54.2
80.4
62.5
76.6
57.6
69.3
69.0
74.5
Apple
37.5
41.7
81.9
59.5
48.9
48.0
81.5
59.0
Xiaomi
26.5
46.5
43.0
48.5
52.5
44.4
45.0
39.0
OPPO
24.5
31.0
34.0
38.0
33.6
38.1
33.9
30.9
vivo
22.5
31.0
33.4
35.5
32.5
33.7
29.3
24.8
Others
110.9
135.0
139.8
96.8
98.0
108.5
112.7
98.1
Total Market
276.1
365.6
394.6
354.9
323.1
342.0
371.4
326.4
*OPPO includes OnePlus since Q3 2021
**Ranking is according to the latest quarter.
Why is the smartphone market declining in Q1 2022?
The global smartphone market growth saw a decline of 7% YoY, shipping 328 million units in Q1 2022 caused by the ongoing component shortages, as well as COVID resurgence at the beginning of the quarter and the Russia-Ukraine war towards the end. The global smartphone market also, as expected, had a seasonal decline of 12% QoQ. The component supply crunch was felt more severely by major Chinese OEMs such as Xiaomi, OPPO* and vivo as compared with Samsung, which seems to have overcome component shortages that affected its supply last year, as evidenced by higher-than-expected growth in its shipments despite a late flagship launch.
Consequently, Samsung regained the top spot from Apple which had emerged as the biggest smartphone vendor globally in Q4 2021 thanks to its latest iPhone 13 series.
Which country has the highest market share of smartphones globally?
With its share at around 22.5% of the global smartphone shipments in Q1 2022, China remains the world’s biggest smartphone market. This is down from around 25.6% in Q1 2021 as China’s economy grew slower than expected due to COVID-related lockdowns and shipment volumes declined by over 19% YoY. While China’s share of global smartphone market growth (shipments) remains flat QoQ thanks to a small peak in demand during Chinese New Year and as the global smartphone market declined QoQ due to seasonality, in terms of absolute shipments, China saw a quarterly decline of over 12%.
HONOR has emerged as the biggest smartphone player in China, chipping into vivo and OPPO*’s shares and stepping into the position previously held by Huawei from which it recently separated. Although vivo did not succeed in regaining the top position due to HONOR’s rise at a time when it is itself facing component shortages, it did recover somewhat thanks to its newly launched mid-end S12 series that is popular with younger customers and the affordable the Y series which showed strong performance in the quarter.
Q4 2021 Highlights
Published Date: February 16, 2022
• Global smartphone market growth saw an increase of 4% YoY to reach 1.39 billion units in 2021. Q4 2021 shipments declined 6% YoY to reach 371 million units.
• Samsung led the global smartphone market in 2021 with annual shipments of 272 million units.
• Apple, Xiaomi, OPPO^ and vivo recorded their highest-ever annual shipments.
• The top five brands gained share due to a significant decline by Huawei, and LG’s exit from the market.
• Apple surpassed Samsung to take the number one spot in Q4 2021 with smartphone shipments increasing by 70% QoQ to 81.5 million units in Q4 2021, despite remaining flat YoY.
• Apple recorded their highest-ever annual shipments of 237.9 million units in 2021 driven by successful launch of iPhone 13 series and consistent performance of iPhone 12 series.
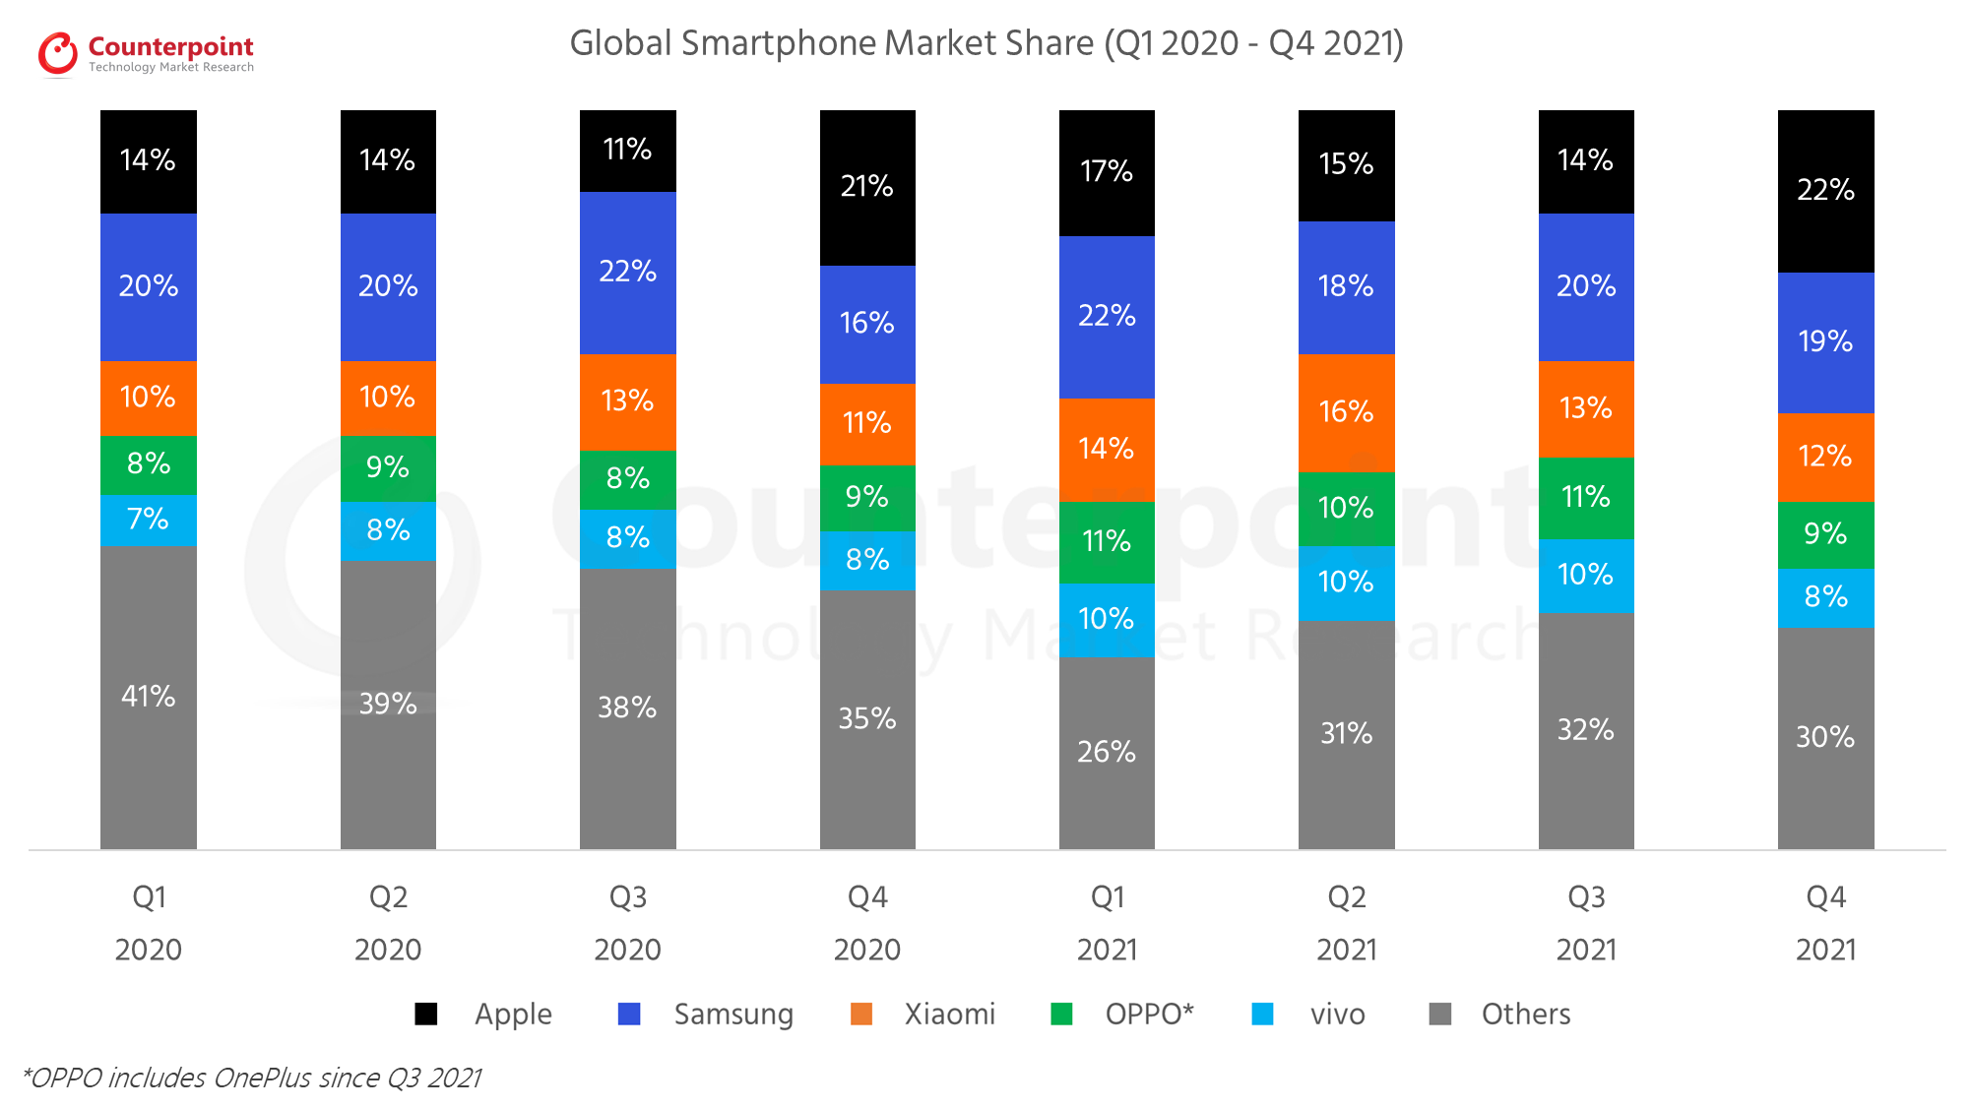
Global Smartphone Shipments Market Share (%)
Brands
Q1
2020
Q2
2020
Q3
2020
Q4
2020
Q1
2021
Q2
2021
Q3
2021
Q4
2021
Apple
14%
14%
11%
21%
17%
15%
14%
22%
Samsung
20%
20%
22%
16%
22%
18%
20%
19%
Xiaomi
10%
10%
13%
11%
14%
16%
13%
12%
OPPO*
8%
9%
8%
9%
11%
10%
11%
9%
vivo
7%
8%
8%
8%
10%
10%
10%
8%
Others
41%
39%
38%
35%
26%
31%
32%
30%
Global Smartphone Shipments (in Millions)
Brands
Q1
2020
Q2
2020
Q3
2020
Q4
2020
Q1
2021
Q2
2021
Q3
2021
Q4
2021
Apple
40.0
37.5
41.7
81.9
59.5
48.9
48.0
81.5
Samsung
58.6
54.2
80.4
62.5
76.6
57.6
69.3
69.0
Xiaomi
29.7
26.5
46.5
43.0
48.5
52.5
44.4
45.0
OPPO*
22.3
24.5
31.0
34.0
38.0
33.6
38.1
33.9
vivo
21.6
22.5
31.0
33.4
35.5
32.5
33.7
29.3
Others
122.8
110.9
135.0
139.8
96.8
98.0
108.5
112.7
Total Market
295.0
276.1
365.6
394.6
354.9
323.1
342.0
371.4
*OPPO includes OnePlus since Q3 2021
**Ranking is according to the latest quarter.
Apple Market Share: Q4 2021
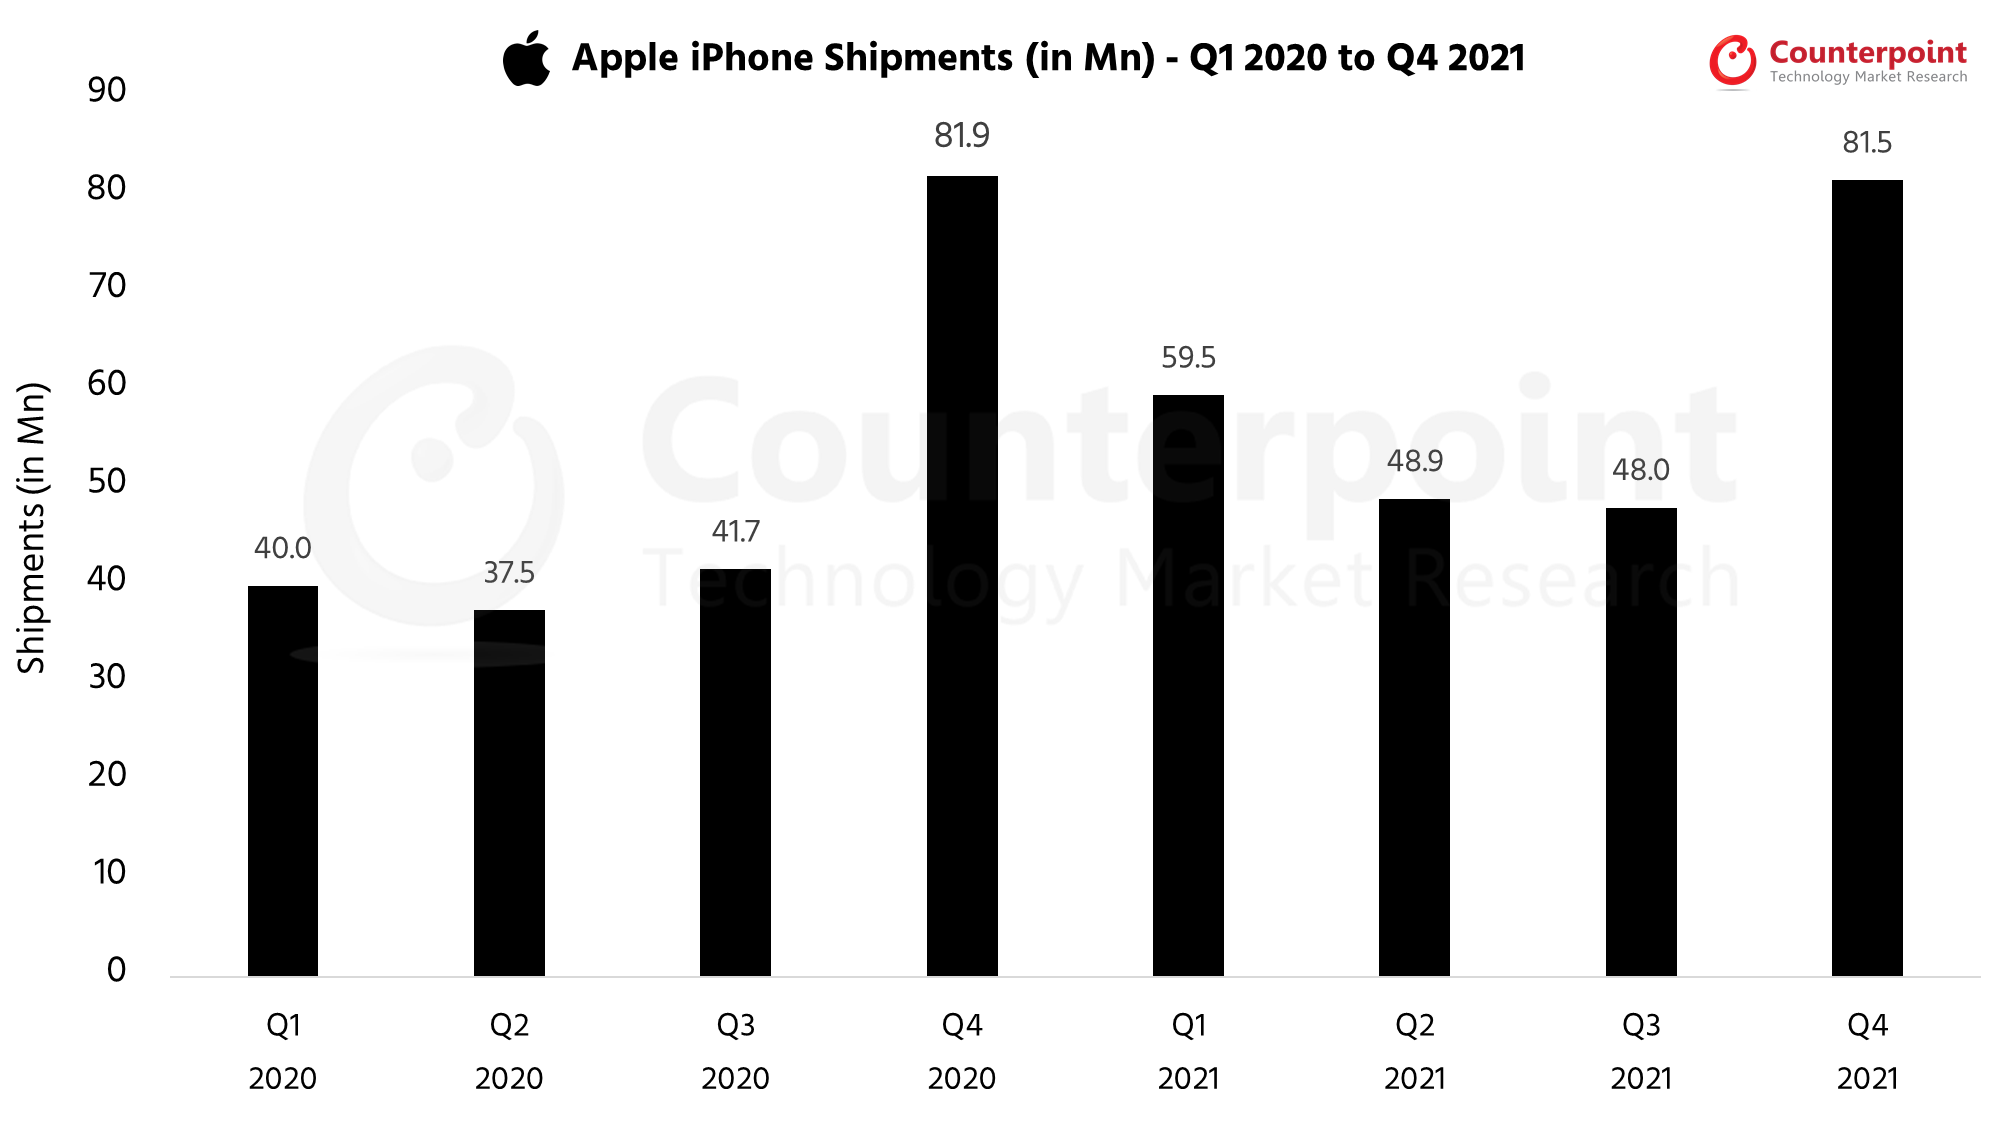
Apple Market Share (iPhone Shipments in Millions)
Quarter
Q1
2020
Q2
2020
Q3
2020
Q4
2020
Q1
2021
Q2
2021
Q3
2021
Q4
2021
Ship-ments (in Mn)
40.0
37.5
41.7
81.9
59.5
48.9
48.0
81.5
Q3 2021 Highlights
Published Date: November 16, 2021
• The global smartphone market growth saw an increase of 6% QoQ but declined by 6% YoY in Q3 2021, clocking global shipments of 342 million units, down from 365.6 million in Q3 2020.
• Samsung retained the number one spot in Q3 2021 with smartphone shipments increasing by 20% QoQ to 69.3 million units in Q3 2021.
• Xiaomi shipped 44.4 million units in Q3 2021, down 5% YoY and 15% QoQ as it was severely hit by the ongoing component shortages.
• vivo grew 8% YoY and 3% QoQ to reach 33.7 million units. vivo continued to lead China’s smartphone market with 17.3 million units in Q3 2021.
• realme achieved its highest-ever shipment performance with 16.2 million units in Q3 2021. The record quarter came at a time when component shortages were at their peak.
• Global handset market wholesale revenue grew 10% YoY and 6% QoQ in Q3 2021 to reach over $103 billion.
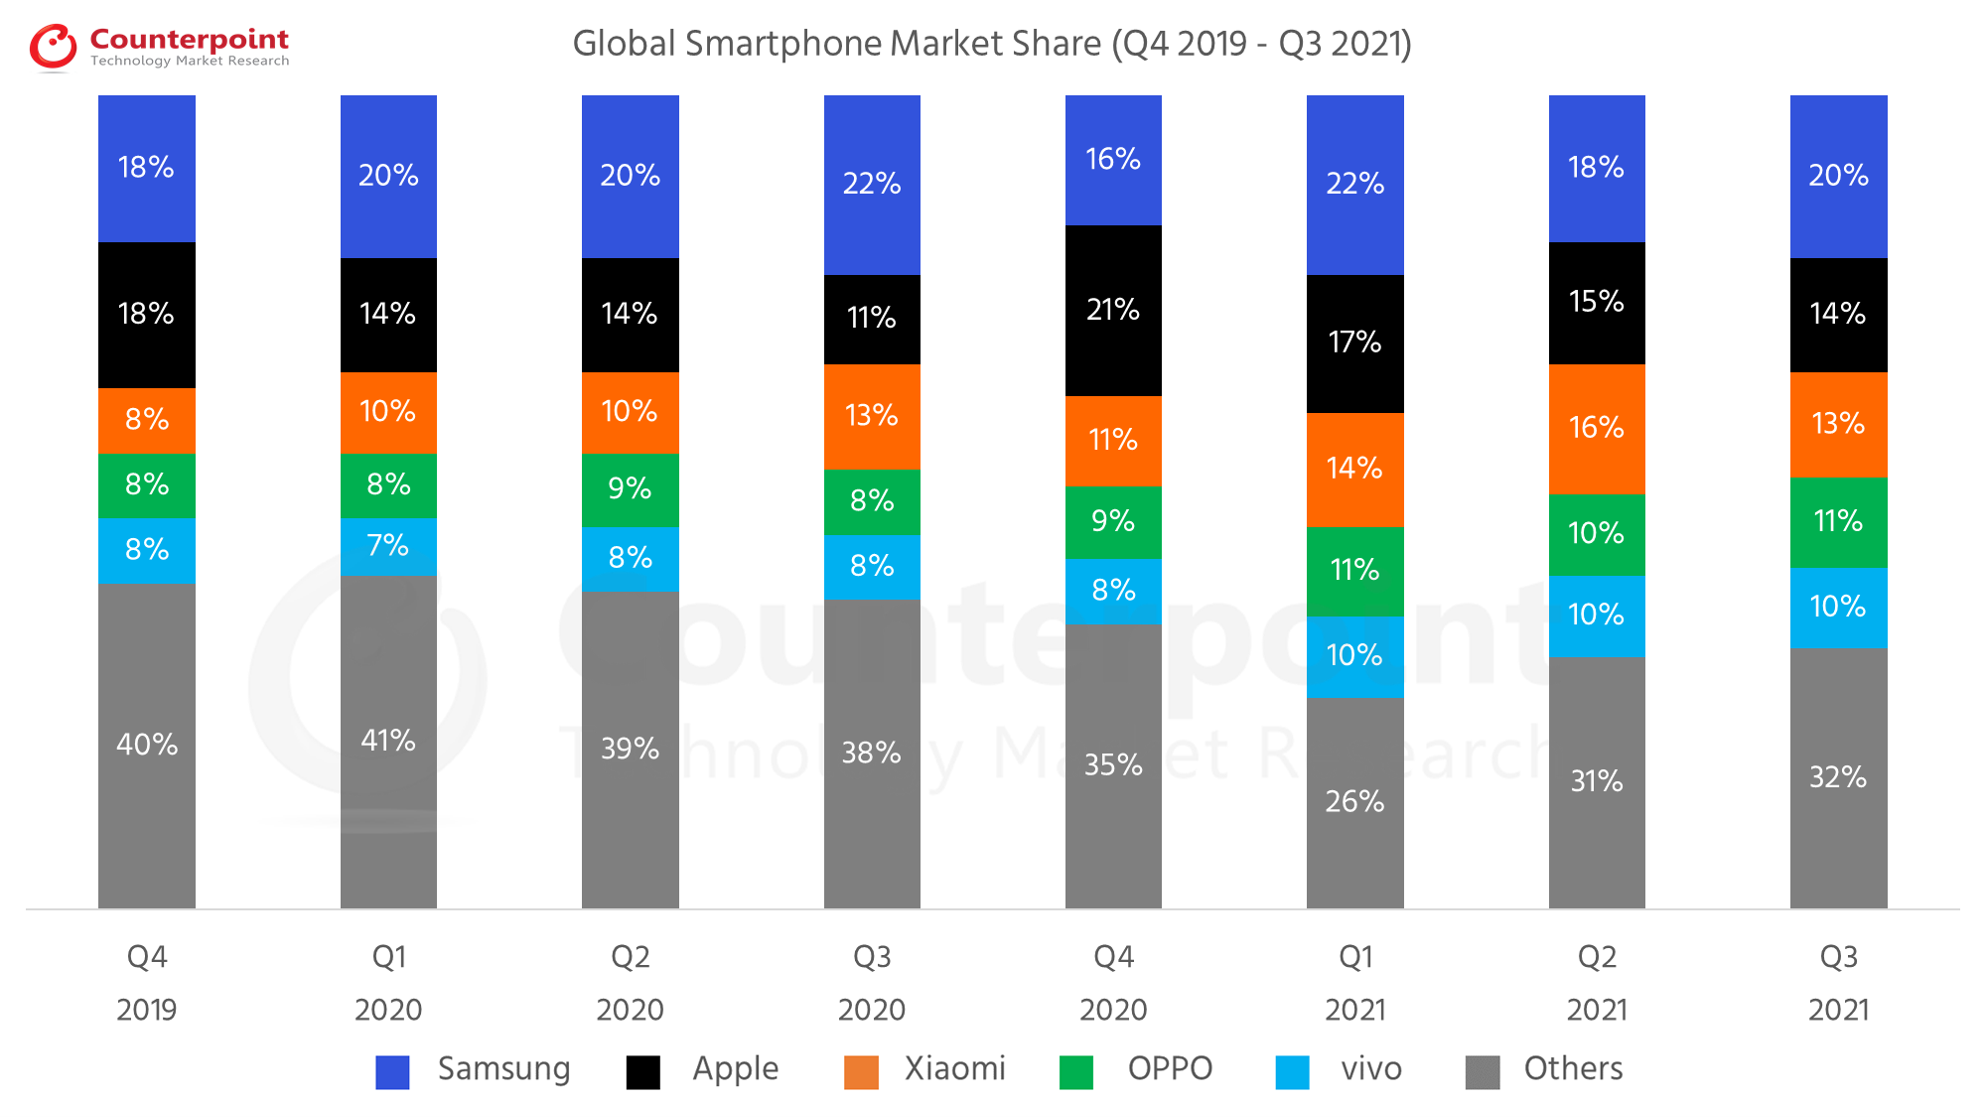
Global Smartphone Shipments Market Share (%)
Brands
Q4
2019
Q1
2020
Q2
2020
Q3
2020
Q4
2020
Q1
2021
Q2
2021
Q3
2021
Samsung
18%
20%
20%
22%
16%
22%
18%
20%
Apple
18%
14%
14%
11%
21%
17%
15%
14%
Xiaomi
8%
10%
10%
13%
11%
14%
16%
13%
OPPO
8%
8%
9%
8%
9%
11%
10%
11%
vivo
8%
7%
8%
8%
8%
10%
10%
10%
Others
40%
41%
39%
38%
35%
26%
31%
32%
Global Smartphone Shipments
Brands
Q4
2019
Q1
2020
Q2
2020
Q3
2020
Q4
2020
Q1
2021
Q2
2021
Q3
2021
Samsung
70.4
58.6
54.2
80.4
62.5
76.6
57.6
69.3
Apple
72.3
40.0
37.5
41.7
81.9
59.5
48.9
48.0
Xiaomi
32.9
29.7
26.5
46.5
43.0
48.5
52.5
44.4
OPPO
30.7
22.3
24.5
31.0
34.0
38.0
33.6
38.1
vivo
31.5
21.6
22.5
31.0
33.4
35.5
32.5
33.7
Others
163.4
122.8
110.9
135.0
139.8
96.8
98.0
108.5
Total Market
401.1
295.0
276.1
365.6
394.6
354.9
323.1
342.0
*Ranking is according to the latest quarter.
Q2 2021 Highlights
Published Date: August 16, 2021
• Global smartphone market grew 19% YoY but declined by 7% QoQ as 323 million units were shipped, led by Samsung.
• Xiaomi eclipses 52 million smartphones, becoming the world’s second-largest smartphone brand for the first time ever.
• Samsung retained the number one spot with shipments reaching 58 million units in Q2 2021, however, its market share declined to 18% as compared to 22% in Q1 2021 as its shipments declined by 24% QoQ.
• realme grew by 135% YoY and 17% QoQ, crossing cumulative shipments of 100 million smartphones since its entry into the smartphone market.
• Global smartphone shipment revenues grew by 25% YoY to $96 billion in Q2 2021 setting a second-quarter record.
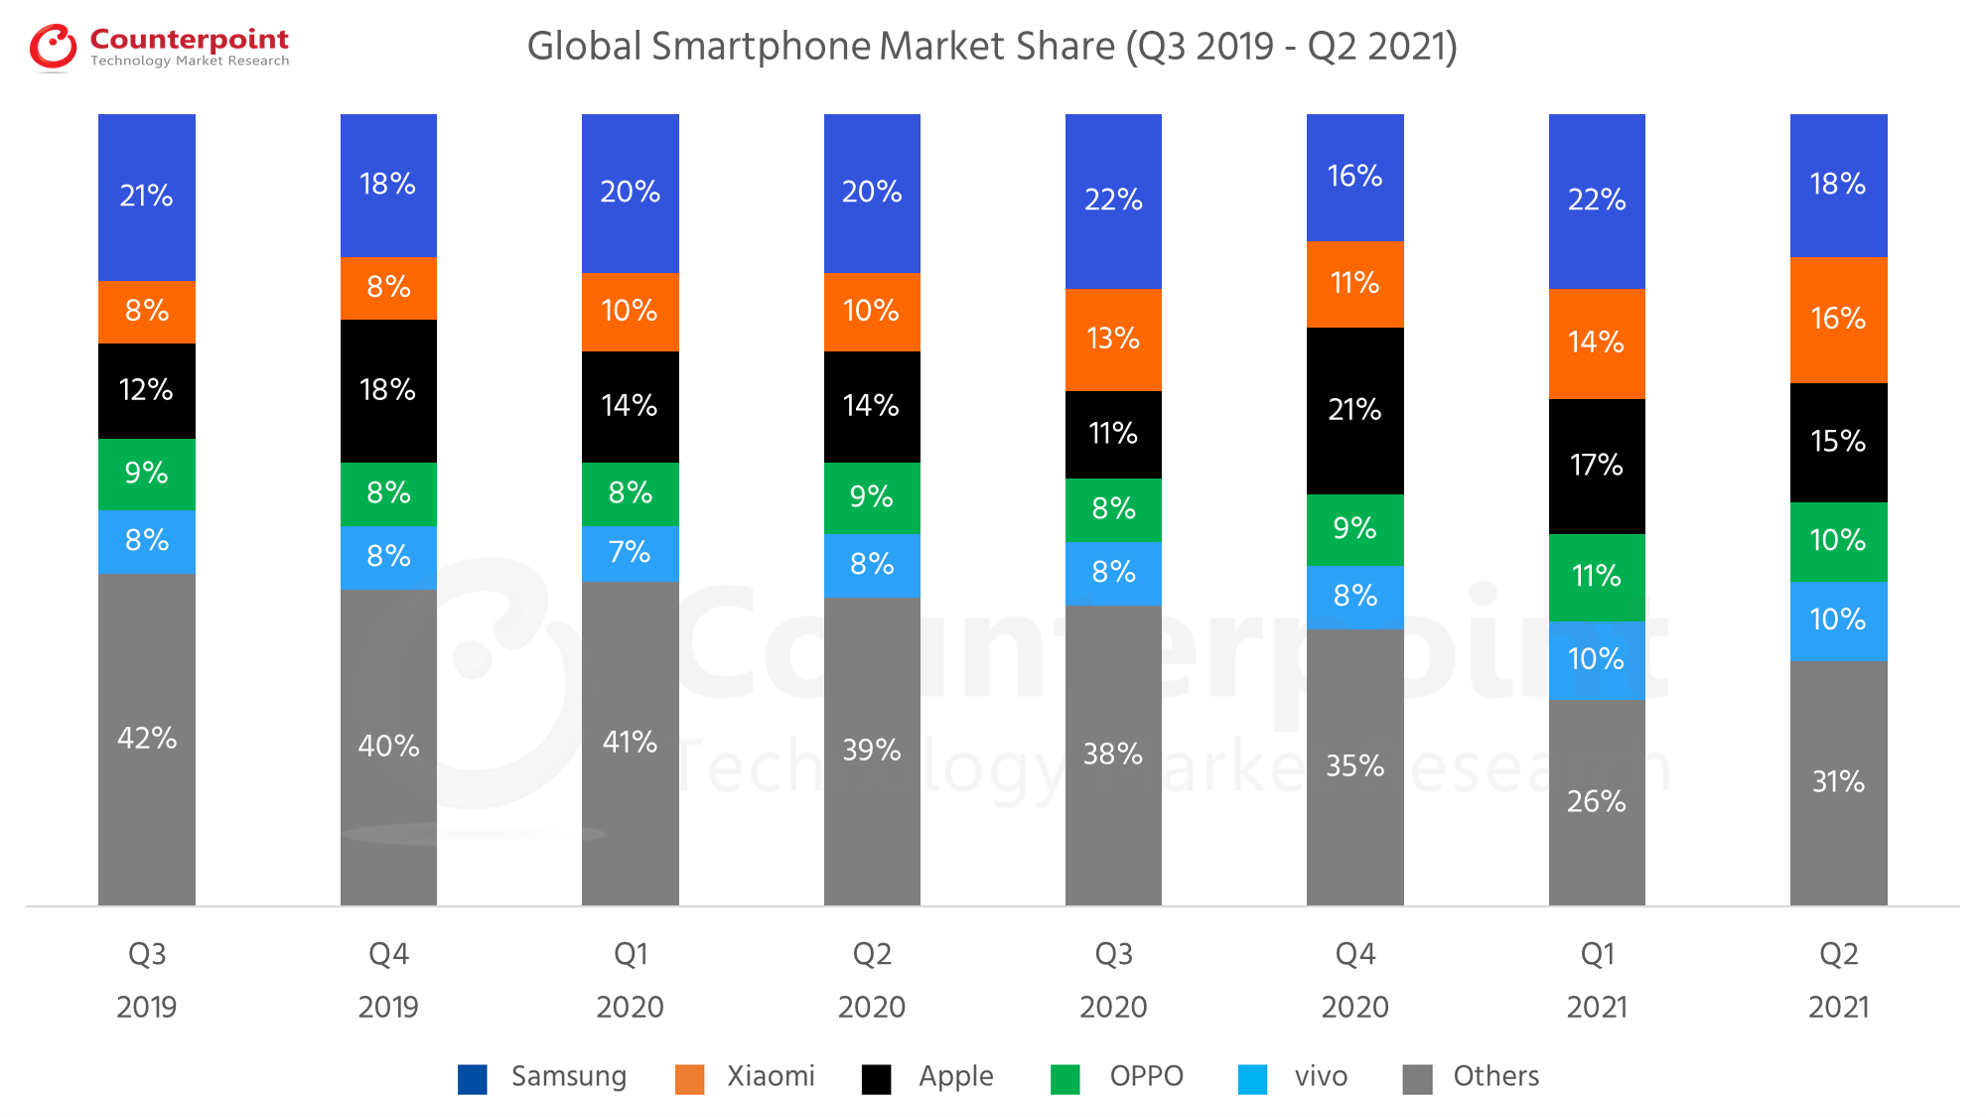
Global Smartphone Shipments Market Share (%)
Brands
Q3
2019
Q4
2019
Q1
2020
Q2
2020
Q3
2020
Q4
2020
Q1
2021
Q2
2021
Samsung
21%
18%
20%
20%
22%
16%
22%
18%
Xiaomi
8%
8%
10%
10%
13%
11%
14%
16%
Apple
12%
18%
14%
14%
11%
21%
17%
15%
OPPO
9%
8%
8%
9%
8%
9%
11%
10%
vivo
8%
8%
7%
8%
8%
8%
10%
10%
Others
42%
40%
41%
39%
38%
35%
26%
31%
Global Smartphone Shipments
Brands
Q3
2019
Q4
2019
Q1
2020
Q2
2020
Q3
2020
Q4
2020
Q1
2021
Q2
2021
Samsung
78.2
70.4
58.6
54.2
80.4
62.5
76.6
57.9
Xiaomi
31.7
32.9
29.7
26.5
46.2
43.0
48.5
52.5
Apple
44.8
72.3
40.0
37.5
41.7
81.9
59.5
48.9
OPPO
32.3
31.4
22.3
24.5
31.0
34.0
38.0
33.6
vivo
31.3
31.5
21.6
22.5
31.0
33.4
35.5
32.5
Others
161.7
162.6
122.8
110.9
135.3
139.8
96.8
97.7
Total
Market
380.0
401.1
295.0
276.1
365.6
394.6
354.9
323.1
*Ranking is according to the latest quarter.
Q1 2021 Highlights
Published Date: May 16, 2021
• Global smartphone shipment revenue crossed the $100 billion mark for the first time for a March-ending quarter to reach $113 billion.
• Global shipments grew 20% YoY, reaching 354 million units, led by OPPO, vivo, Xiaomi and Apple.
• Samsung regained its top spot as the world’s biggest OEM, with shipments reaching 76.8 million units in Q1 2021.
• Apple iPhone active installed base reached a new high this quarter.
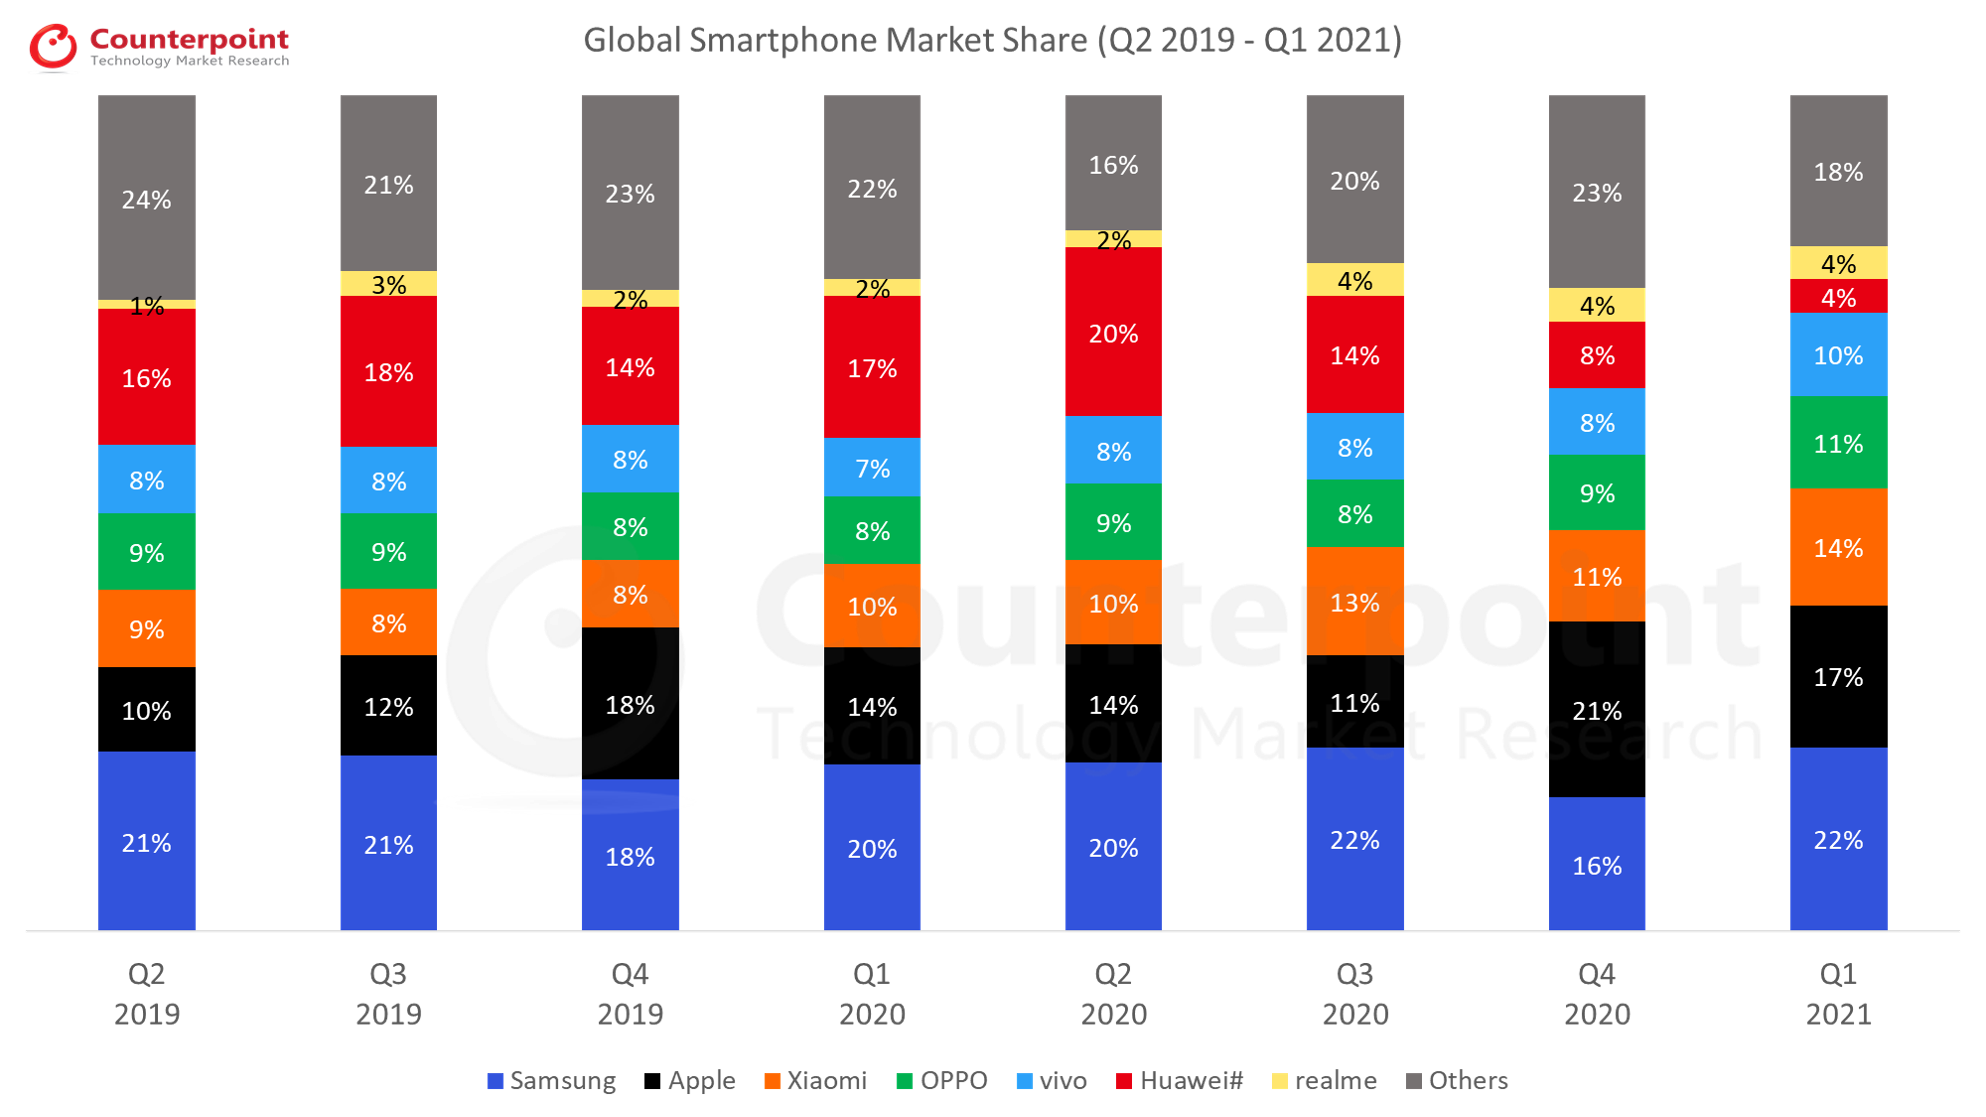
Global Smartphone Shipments Market Share (%)
Brands
Q2
2019
Q3
2019
Q4
2019
Q1
2020
Q2
2020
Q3
2020
Q4
2020
Q1
2021
Samsung
21%
21%
18%
20%
20%
22%
16%
22%
Apple
10%
12%
18%
14%
14%
11%
21%
17%
Xiaomi
9%
8%
8%
10%
10%
13%
11%
14%
OPPO
9%
9%
8%
8%
9%
8%
9%
11%
vivo
8%
8%
8%
7%
8%
8%
8%
10%
Huawei#
16%
18%
14%
17%
20%
14%
8%
4%
realme
1%
3%
2%
2%
2%
4%
4%
4%
Others
24%
21%
23%
22%
16%
20%
23%
18%
Global Smartphone Shipments
Brands
Q2
2019
Q3
2019
Q4
2019
Q1
2020
Q2
2020
Q3
2020
Q4
2020
Q1
2021
Samsung
76.3
78.2
70.4
58.6
54.2
80.4
62.5
76.6
Apple
36.5
44.8
72.3
40.0
37.5
41.7
81.9
59.5
Xiaomi
32.3
31.7
32.9
29.7
26.5
46.2
43.0
48.5
OPPO
30.6
32.3
31.4
22.3
24.5
31.0
34.0
38.0
vivo
27.0
31.3
31.5
21.6
22.5
31.0
33.4
35.5
Huawei#
56.6
66.8
56.2
49.0
54.8
50.9
33.0
15.0
realme
5.0
10.2
7.8
7.2
6.4
14.8
14.0
12.8
Others
92.8
84.7
98.6
66.6
49.7
69.6
92.8
69.0
Total
Market
357.1
380.0
401.1
295.0
276.1
365.6
394.6
354.9
*Ranking is according to the latest quarter.
#Huawei includes HONOR in all quarters except Q1 2021 reflecting the separation of the two brands.
Q4 2020 Highlights
Published Date: February 16, 2021
• The global smartphone market continued to recover in Q4 2020, rebounding 8% QoQ to 395.9 million units.
• Apple’s 8% YoY and 96% QoQ growth helped it lead the market in Q4 2020.
• Samsung slipped to the second spot with 62.5 million units in Q4 2020, However, it led the overall market in CY 2020.
• For the first time, OPPO and vivo surpassed Huawei to capture the fourth and fifth spots respectively, Huawei slipped to the sixth spot.
• realme emerged as the fastest growing brand in CY 2020 with 65% YoY growth.
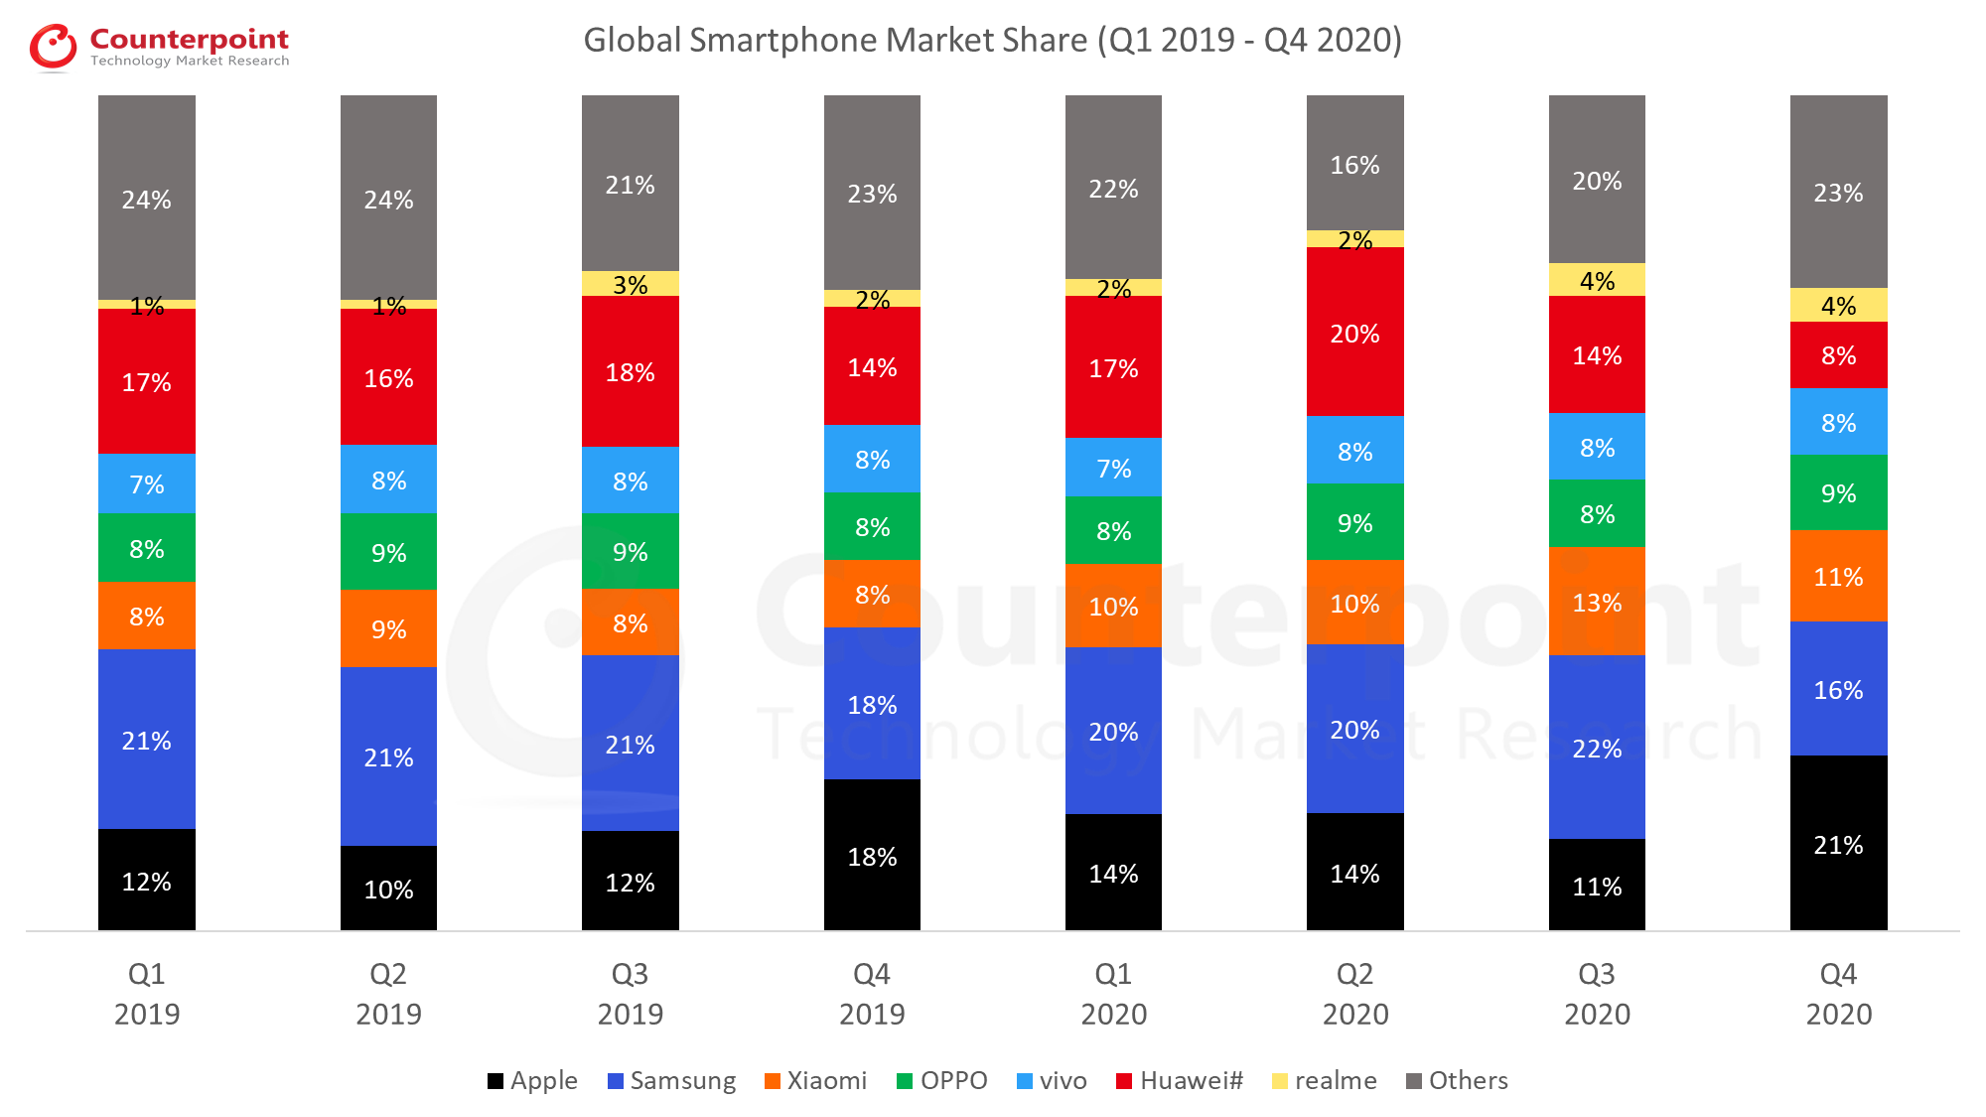
Global Smartphone Shipments Market Share (%)
Brands
Q1
2019
Q2
2019
Q3
2019
Q4
2019
Q1
2020
Q2
2020
Q3
2020
Q4
2020
Apple
12%
10%
12%
18%
14%
14%
11%
21%
Samsung
21%
21%
21%
18%
20%
20%
22%
16%
Xiaomi
8%
9%
8%
8%
10%
10%
13%
11%
OPPO
8%
9%
9%
8%
8%
9%
8%
9%
vivo
7%
8%
8%
8%
7%
8%
8%
8%
Huawei#
17%
16%
18%
14%
17%
20%
14%
8%
realme
1%
1%
3%
2%
2%
2%
4%
4%
Others
24%
24%
21%
23%
22%
16%
20%
23%
Global Smartphone Shipments
Brands
Q1
2019
Q2
2019
Q3
2019
Q4
2019
Q1
2020
Q2
2020
Q3
2020
Q4
2020
Apple
42.0
36.5
44.8
72.3
40.0
37.5
41.7
81.9
Samsung
72.0
76.3
78.2
70.4
58.6
54.2
80.4
62.5
Xiaomi
27.8
32.3
31.7
32.9
29.7
26.5
46.2
43.0
OPPO
25.7
30.6
32.3
31.4
22.3
24.5
31.0
34.0
vivo
23.9
27.0
31.3
31.5
21.6
22.5
31.0
33.4
Huawei#
59.1
56.6
66.8
56.2
49.0
54.8
50.9
33.0
realme
2.8
5.0
10.2
7.8
7.2
6.4
14.8
14.0
Others
87.7
92.8
84.7
98.6
66.6
49.7
69.6
92.8
*Ranking is according to the latest quarter.
#Huawei includes HONOR.
Q3 2020 Highlights
- Samsung regained the top spot, shipping 80.4 million units with 48% QoQ and 3% YoY growth with the highest ever shipment in the last three years.
- Realme shipment grew 132% QoQ, becoming the world’s fastest brand to hit 50 million shipments since inception.
- Xiaomi grew 75% QoQ contributing 13% in total smartphone shipment. Notably, this was also the first time when Xiaomi surpassed Apple to capture the third spot.
- The market share for BBK Group (OPPO, Vivo, Realme, and OnePlus) has increased from 20% in Q2 to 22% in Q3 2020. The group is close to becoming the largest smartphone manufacturer group globally with three of its brands in the top 10.
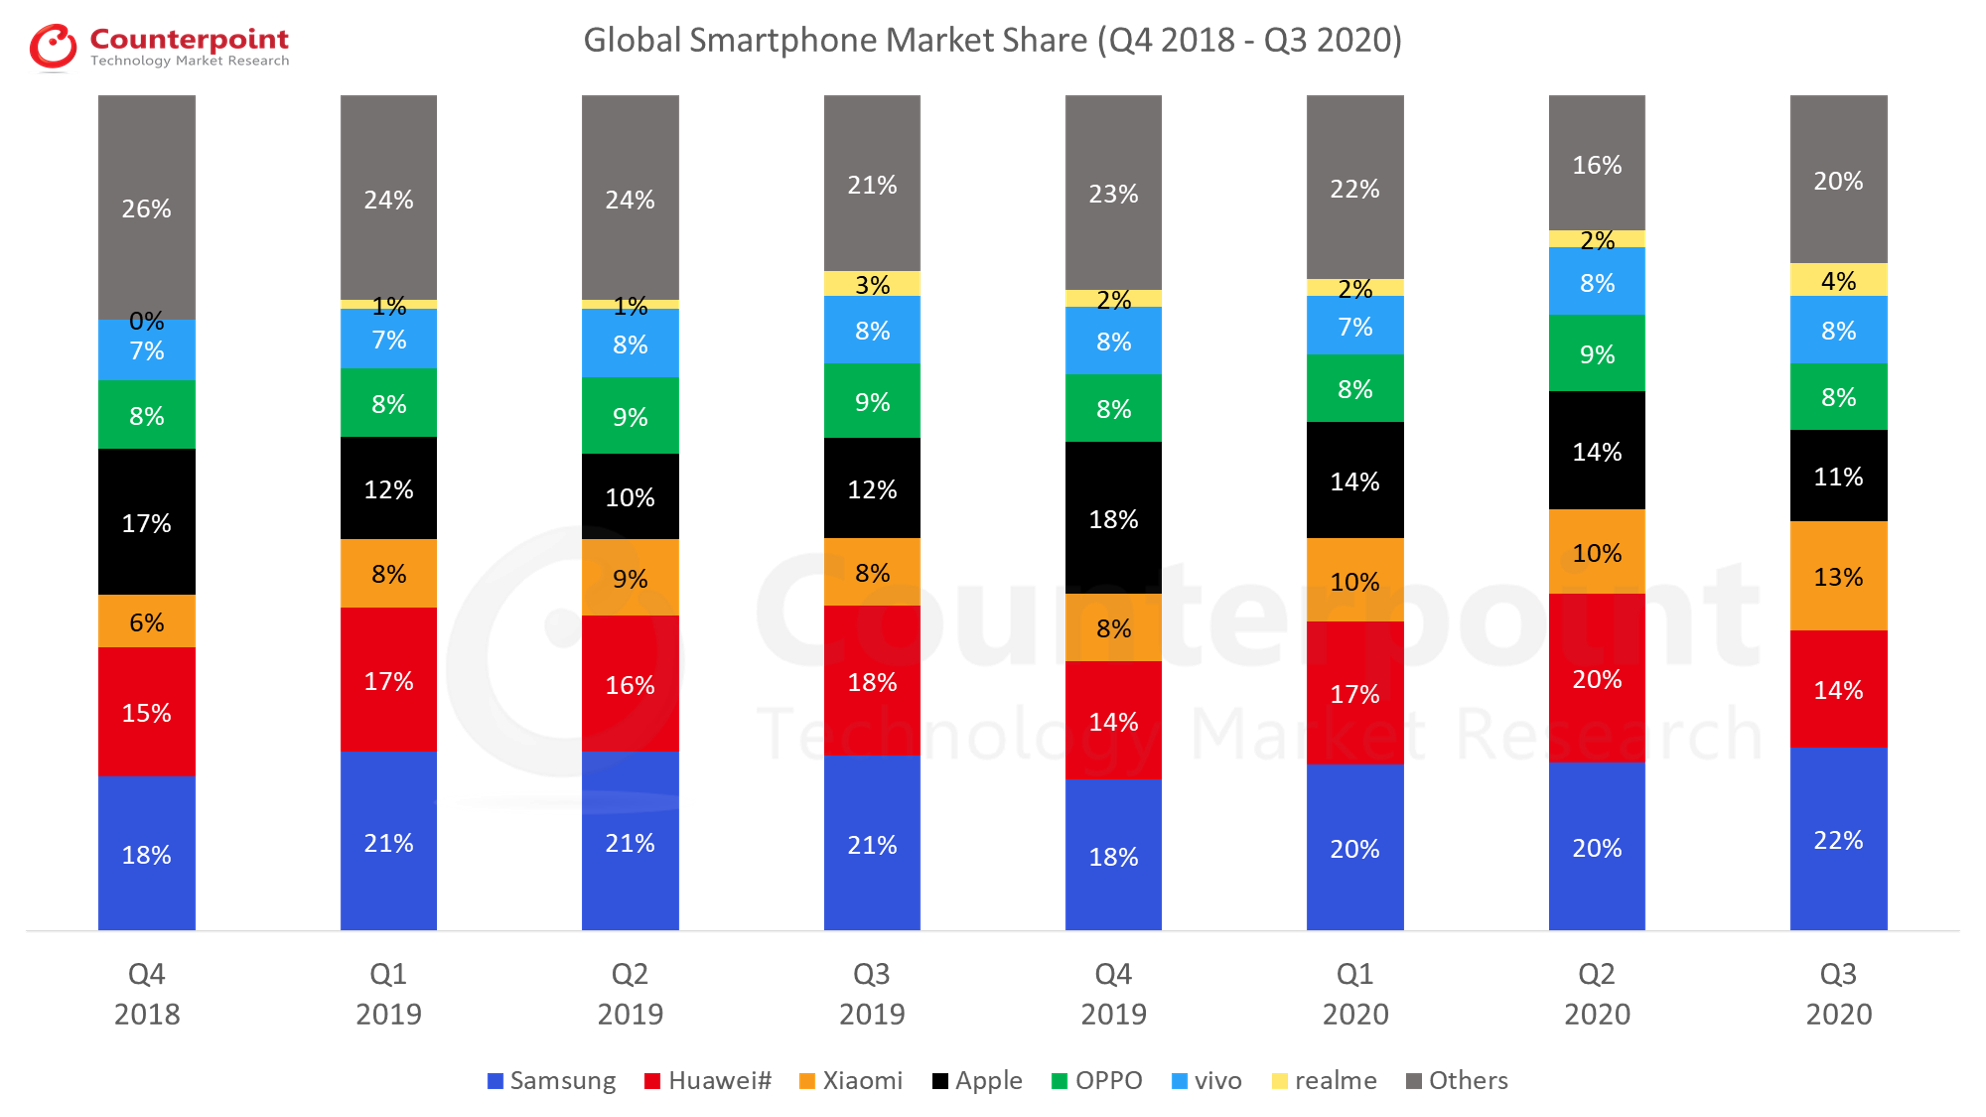
Global Smartphone Shipments Market Share (%)
Brands
Q4
2018
Q1
2019
Q2
2019
Q3
2019
Q4
2019
Q1
2020
Q2
2020
Q3
2020
Samsung
18%
21%
21%
21%
18%
20%
20%
22%
Huawei#
15%
17%
16%
18%
14%
17%
20%
14%
Xiaomi
6%
8%
9%
8%
8%
10%
10%
13%
Apple
17%
12%
10%
12%
18%
14%
14%
11%
OPPO
8%
8%
9%
9%
8%
8%
9%
8%
vivo
7%
7%
8%
8%
8%
7%
8%
8%
realme
–
1%
1%
3%
2%
2%
2%
4%
Others
26%
24%
24%
21%
23%
22%
16%
20%
Global Smartphone Shipments
Brands
Q4
2018
Q1
2019
Q2
2019
Q3
2019
Q4
2019
Q1
2020
Q2
2020
Q3
2020
Samsung
69.8
72.0
76.3
78.2
70.4
58.6
54.2
80.4
Huawei#
59.7
59.1
56.6
66.8
56.2
49.0
54.8
50.9
Xiaomi
25.6
27.8
32.3
31.7
32.9
29.7
26.5
46.2
Apple
65.9
42.0
36.5
44.8
72.3
40.0
37.5
41.7
OPPO
31.3
25.7
30.6
32.3
31.4
22.3
24.5
31.0
vivo
26.5
23.9
27.0
31.3
31.5
21.6
22.5
31.0
realme
–
2.8
5.0
10.2
7.8
7.2
6.4
14.8
Others
115.8
87.7
92.8
84.7
98.6
66.6
48.6
69.6
*Ranking is according to the latest quarter.
#Huawei includes HONOR.
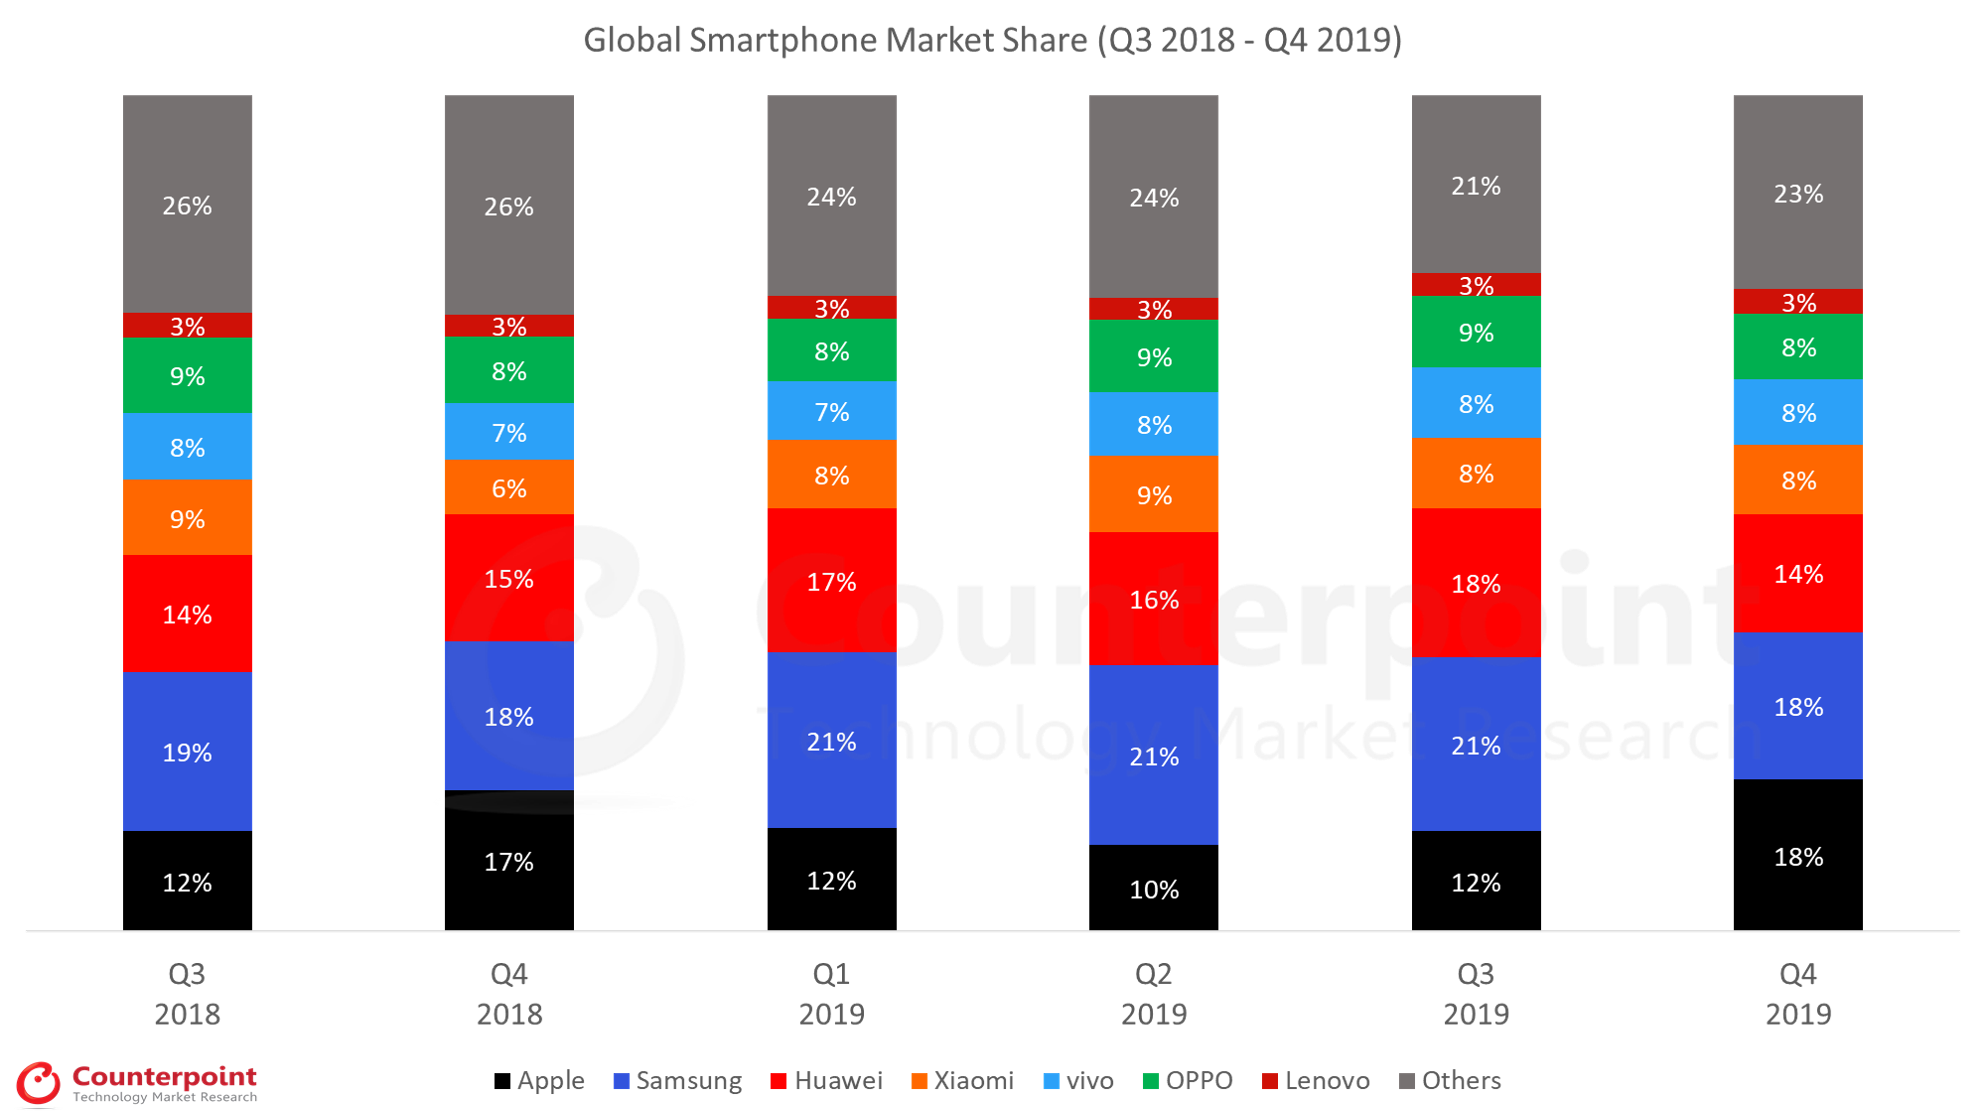
Q2 2020 Highlights
- The share of the top 10 brands reached 88% compared to 80% last year. Brands outside of the top 10 declined 55% YoY. The impact of COVID-19 was more severe on smaller brands that tend to have lower online presence and that tend to cater more to the entry-level segments.
- Huawei continued its push in China and surpassed Samsung to lead the global smartphone market. Huawei’s shipments declined only 3% YoY globally as it grew 11% YoY in China.
- Samsung declined 29% YoY as its core markets including LATAM, India, the USA and Europe were struggling from the effects of the pandemic and lockdowns.
- realme was the only major brand achieving double-digit annual growth. realme grew 11% YoY in the quarter as several markets in Europe and India recovered in June. realme was also the fastest-growing brand in the quarter and was number 7th in terms of sales.
- Apple iPhone shipments grew 3% YoY and revenues grew 2% YoY. The company saw sustained momentum of the iPhone 11 and a great sales start of the iPhone SE. All regions saw revenue growth.
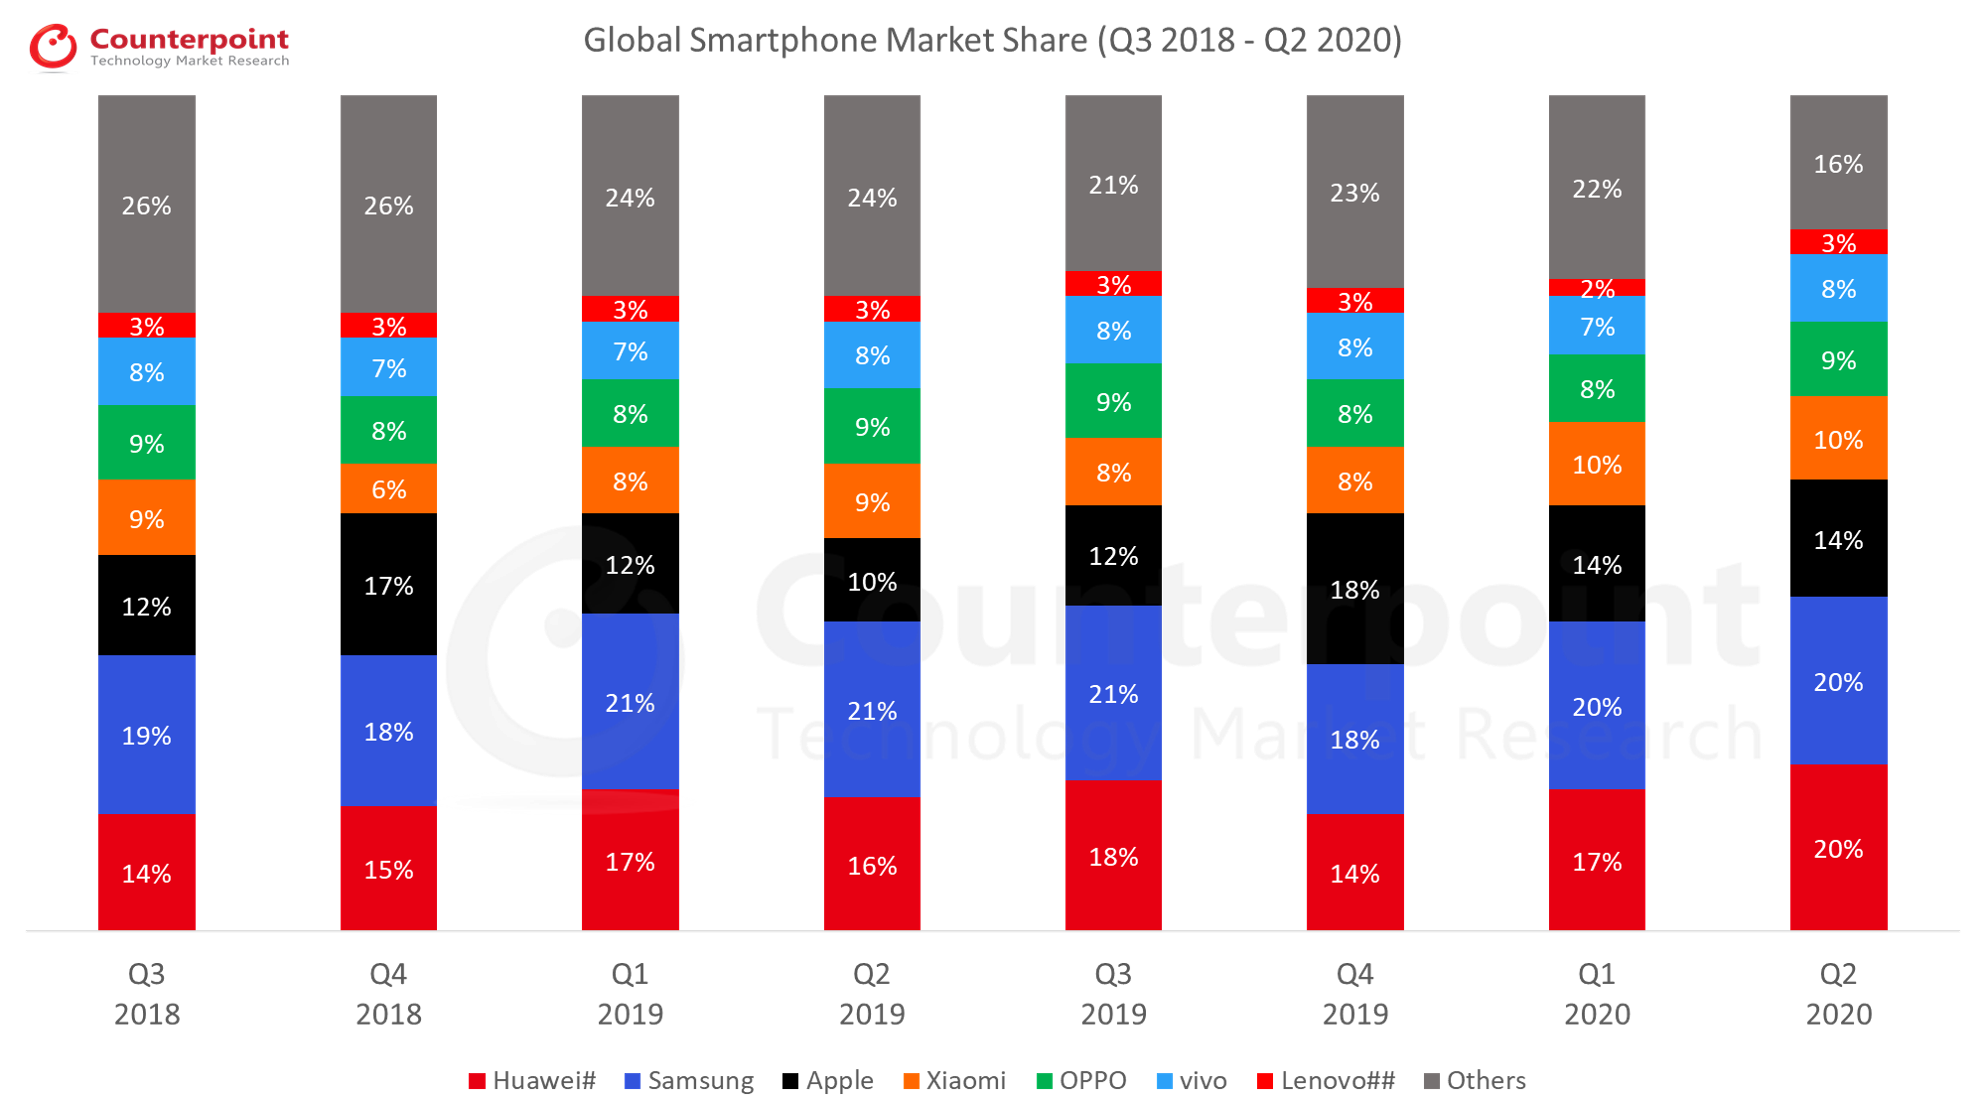
Global Smartphone Shipments Market Share (%)
Brands
Q3
2018
Q4
2018
Q1
2019
Q2
2019
Q3
2019
Q4
2019
Q1
2020
Q2
2020
Huawei#
14%
15%
17%
16%
18%
14%
17%
20%
Samsung
19%
18%
21%
21%
21%
18%
20%
20%
Apple
12%
17%
12%
10%
12%
18%
14%
14%
Xiaomi
9%
6%
8%
9%
8%
8%
10%
10%
OPPO
9%
8%
8%
9%
9%
8%
8%
9%
vivo
8%
7%
7%
8%
8%
8%
7%
8%
Lenovo##
3%
3%
3%
3%
3%
3%
2%
3%
Others
26%
26%
24%
24%
21%
23%
22%
16%
Global Smartphone Shipments
Brands
Q3
2018
Q4
2018
Q1
2019
Q2
2019
Q3
2019
Q4
2019
Q1
2020
Q2
2020
Huawei#
52.0
59.7
59.1
56.6
66.8
56.2
49.0
54.8
Samsung
72.3
69.8
72.0
76.3
78.2
70.4
58.6
54.2
Apple
46.9
65.9
42.0
36.5
44.8
72.3
40.0
37.5
Xiaomi
33.3
25.6
27.8
32.3
31.7
32.9
29.7
26.5
OPPO
33.9
31.3
25.7
30.6
32.3
31.4
22.3
24.5
vivo
30.5
26.5
23.9
27.0
31.3
31.5
21.6
22.5
Lenovo##
11.0
10.1
9.5
9.5
10.0
11.7
5.9
7.5
Others
110.9
115.8
87.7
92.8
84.7
98.6
66.6
48.6
*Ranking is according to the latest quarter.
#Huawei includes HONOR.
##Lenovo includes Motorola.
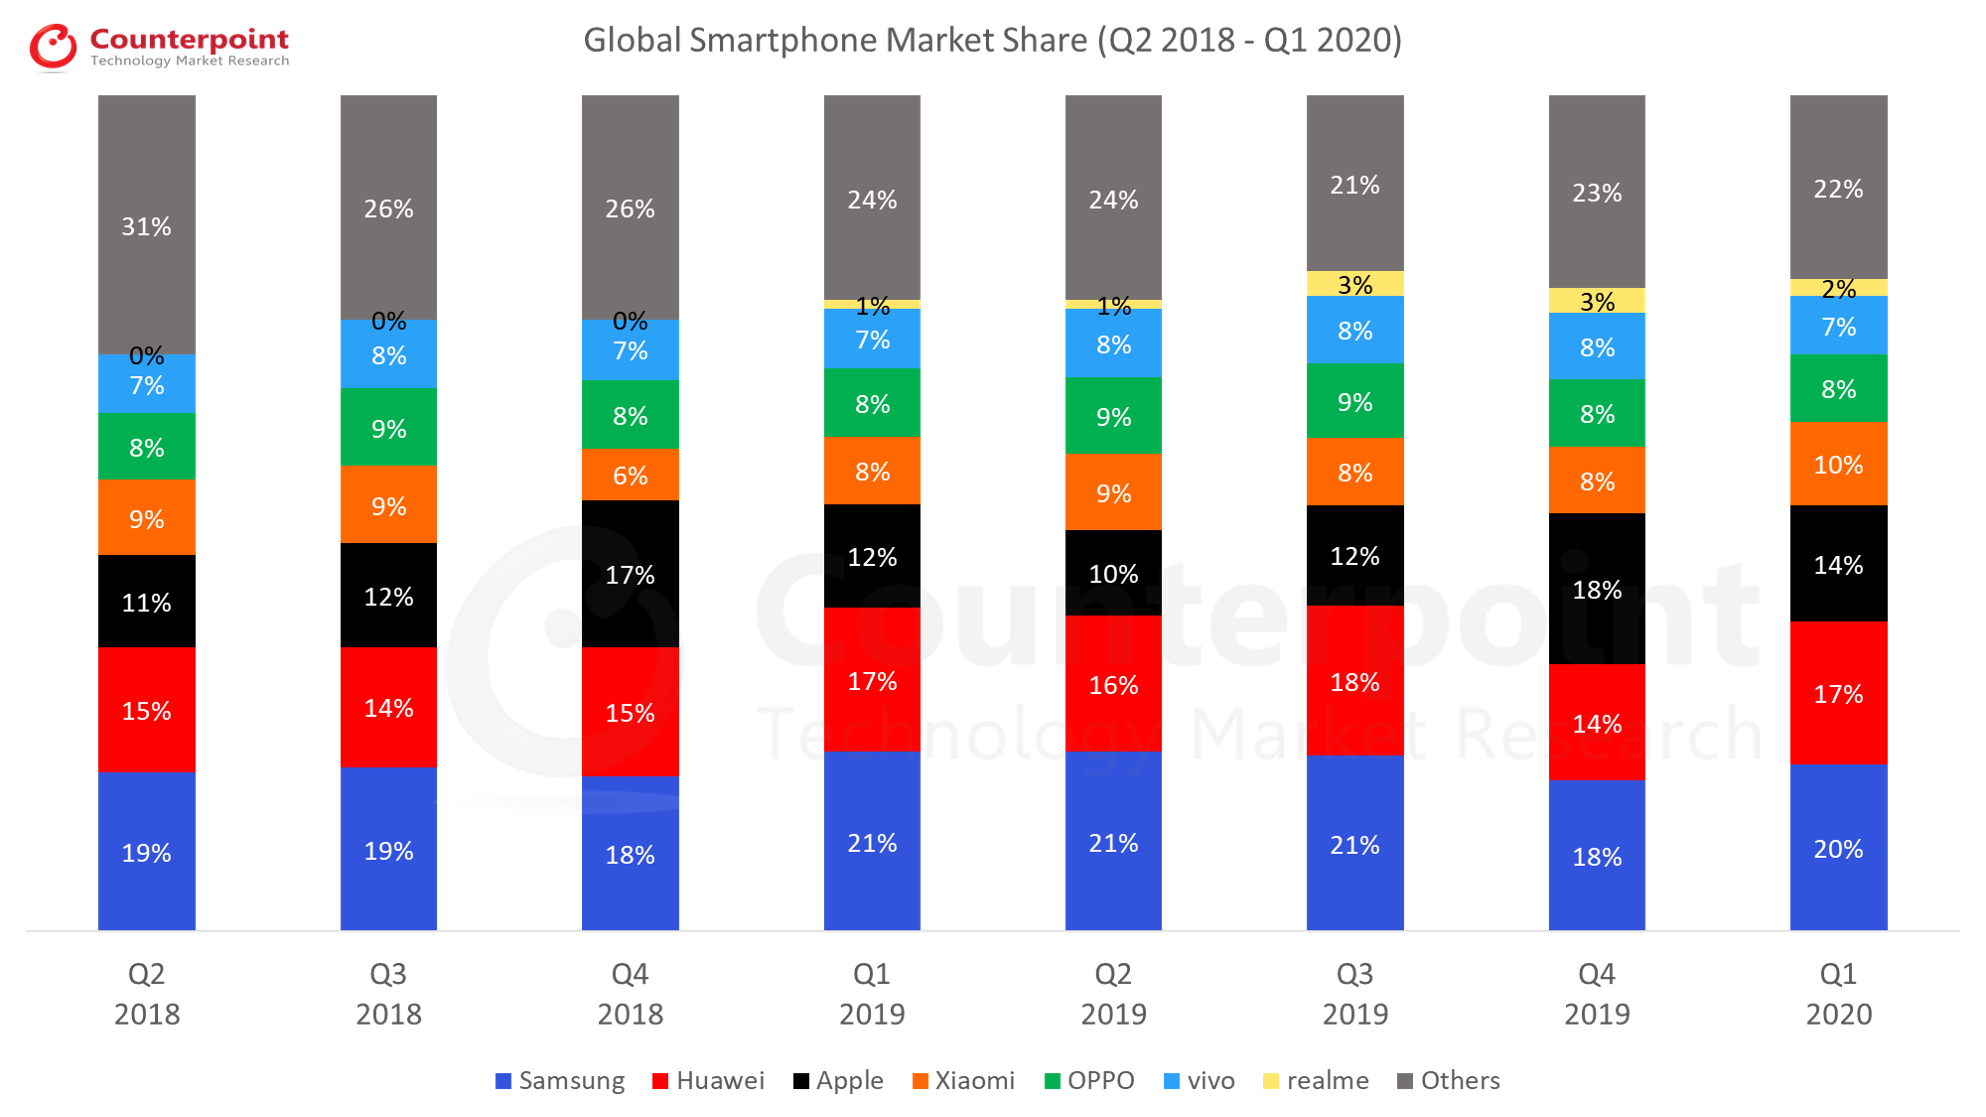
Q1 2020 Highlights
- The global smartphone market declined its fastest ever, down 13% YoY in Q1 2020.
- This is the first time since Q1 2014, that the smartphone market has fallen below 300Mn units in a quarter.
- The COVID-19 pandemic has disrupted the signs of any recovery that the market started showing in Q4 2019.
- Samsung led the smartphone market during the quarter capturing one-fifth of the global smartphone shipments. The OEM declined 18% YoY during the quarter and is expected to see a steeper decline in Q2 2020.
- Huawei continued its push in China and surpassed Apple again during the quarter. The OEM declined 17% YoY during the quarter. Over half of the smartphone shipments for Huawei are now in China.
- Apple remained resilient even during the COVID-19 as iPhone shipments declined only 5% YoY during the quarter. The iPhone revenues were down 7% YoY for the same period. The impact on some European and Asian countries was mild.
- Xiaomi grew 7% YoY during the quarter. The OEM continued to lead the India smartphone market reaching its highest ever market share (30%) since Q1 2018.
- Compared to other major OEMs, Vivo declined less (10% YoY) during the quarter. A strong performance in the Indian Smartphone Market partially offset declines in other markets.
Global Smartphone Shipments Market Share (%)
Brands
Q2
2018
Q3
2018
Q4
2018
Q1
2019
Q2
2019
Q3
2019
Q4
2019
Q1
2020
Samsung
19%
19%
18%
21%
21%
21%
18%
20%
Huawei
15%
14%
15%
17%
16%
18%
14%
17%
Apple
11%
12%
17%
12%
10%
12%
18%
14%
Xiaomi
9%
9%
6%
8%
9%
8%
8%
10%
OPPO
8%
9%
8%
8%
9%
9%
8%
8%
vivo
7%
8%
7%
7%
8%
8%
8%
7%
realme
0%
0%
0%
1%
1%
3%
3%
2%
Others
31%
26%
26%
24%
24%
21%
23%
22%
Global Smartphone Shipments
Brands
Q2
2018
Q3
2018
Q4
2018
Q1
2019
Q2
2019
Q3
2019
Q4
2019
Q1
2020
Samsung
71.5
72.3
69.8
72.0
76.3
78.2
70.4
58.6
Huawei
54.2
52.0
59.7
59.1
56.6
66.8
56.2
49.0
Apple
41.3
46.9
65.9
42.0
36.5
44.8
72.3
40.0
Xiaomi
32.0
33.3
25.6
27.8
32.3
31.7
32.9
29.7
OPPO
29.6
33.9
31.3
25.7
30.6
32.3
31.4
22.3
vivo
26.5
30.5
26.5
23.9
27.0
31.3
31.5
21.6
realme
–
–
–
2.8
5.0
10.2
7.8
7.2
Others
113.3
110.9
115.8
87.7
92.8
84.7
98.6
66.6
*Ranking is according to latest quarter.
#Huawei includes HONOR.
Q4 2019 Highlights
- Global mobile phone shipments reached 507 million units globally in Q4 2019 with a YoY decline of -1%.
- Global smartphone shipments reached 401 million units in Q4 2019 showing a 2% YoY growth as compared to Q4 2018.
- The top three brands, Samsung, Huawei and Apple, captured more than 50% of the smartphone market, with the rest of the market left for hundreds of other brands to compete fiercely.
- Samsung remained flat during 2019 Q4 while grew 2% YoY for CY 2019. Samsung has been one of the leading players in 5G in 2019, shipping over 6.5 Million 5G capable devices in 2019.
- Apple iPhone shipments grew 10% YoY during the Q4 2019 even without a 5G variant. The iPhone 11 series received an excellent consumer response in all regions. The dual-camera and lower pricing of iPhone 11 helped propel sales.
- realme continued its growth streak and remained the fastest growing brand during the quarter (163% YoY) as well as the year (453% YoY). The brand entered the top five in the Indian market for the full year, which contributed to its strong growth.
 Source: Market Monitor Q4 2019
Global Smartphone Shipments Market Share (%)
Brands
Q3
2018
Q4
2018
Q1
2019
Q2
2019
Q3
2019
Q4
2019
Apple
12%
17%
12%
10%
12%
18%
Samsung
19%
18%
21%
21%
21%
18%
Huawei
14%
15%
17%
16%
18%
14%
Xiaomi
9%
6%
8%
9%
8%
8%
vivo
8%
7%
7%
8%
8%
8%
OPPO
9%
8%
8%
9%
9%
8%
Lenovo
3%
3%
3%
3%
3%
3%
Others
26%
26%
24%
24%
21%
23%
Global Smartphone Shipments
Brands
Q3
2018
Q4
2018
Q1
2019
Q2
2019
Q3
2019
Q4
2019
Apple
46.9
65.9
42.0
36.5
44.8
72.3
Samsung
72.3
69.8
72.0
76.3
78.2
70.4
Huawei
52.0
59.7
59.1
56.6
66.8
56.2
Xiaomi
33.3
25.6
27.8
32.3
31.7
32.9
vivo
30.5
26.5
23.9
27.0
31.3
31.5
Oppo
33.9
31.3
25.7
30.6
32.3
31.4
Lenovo
11.0
10.1
9.5
9.5
10.0
11.7
Others
99.9
105.7
81.0
88.2
84.9
94.7
*Ranking is according to latest quarter.
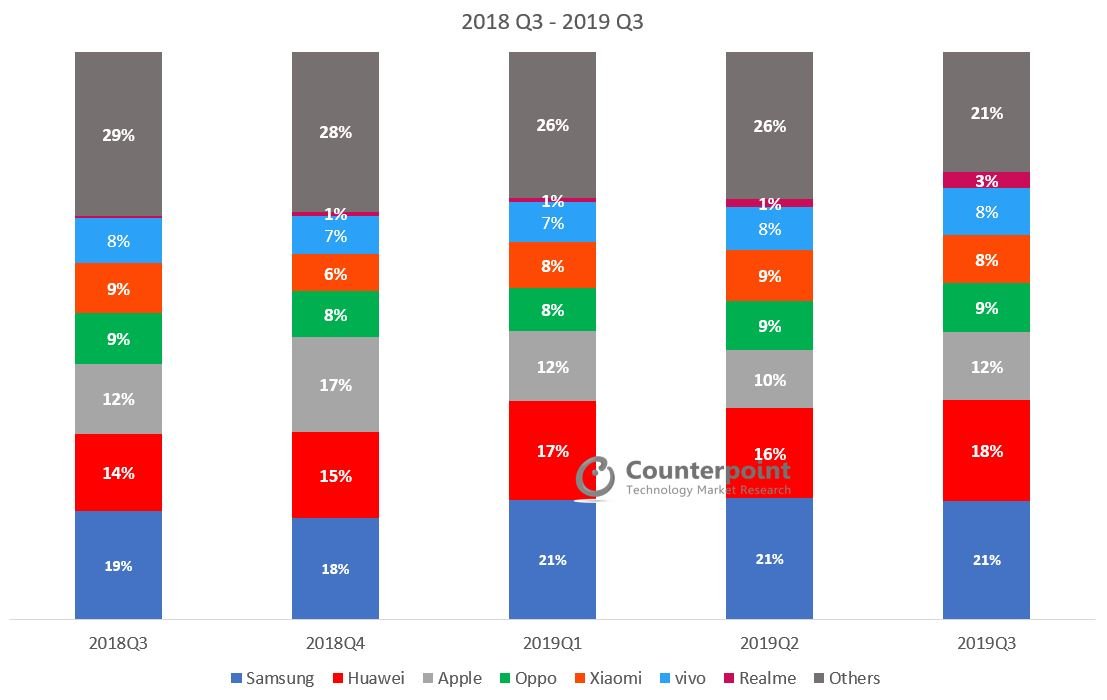
Q3 2019 Highlights
- The top three brands, Samsung, Huawei and Apple, together cornered almost half of the smartphone market, with the rest of the market left for hundreds of other brands to compete fiercely.
- Samsung continued its growth at 8.4% YoY, capturing over one-fifth of the global smartphone market. This is due to strong Note 10 and Galaxy A series sales.
- Huawei grew a very healthy 28.5% YoY globally. It captured a record 40% market share in the Chinese smartphone market.
- Apple iPhone shipments were down 4%, and as a result revenues fell 11% YoY.
- Realme remained the fastest-growing brand for the second time.
- BBK Group (OPPO, Vivo, Realme, and OnePlus) is close to becoming the largest smartphone manufacturer group globally, accounting for over 20% of the global smartphone market and three of its brands in the top 10.
Source: MOBILE DEVICES MONITOR – Q3 2019 (Vendor Region Countries)
[Global Smartphone Share(%)]
Global Smartphone Shipments Market Share (%)
2018
Q3
2018
Q4
2019
Q1
2019
Q2
2019
Q3
Samsung
19%
18%
21%
21%
21%
Huawei#
14%
15%
17%
16%
18%
Apple
12%
17%
12%
10%
12%
Oppo
9%
8%
8%
9%
9%
Xiaomi
9%
6%
8%
9%
8%
vivo
8%
7%
7%
8%
8%
Realme
0%
1%
1%
1%
3%
Others
29%
28%
26%
26%
21%
[Global Smartphone Shipments (Millions of Units)]
Global Smartphone Shipments
2018Q3
2018Q4
2019Q1
2019Q2
2019Q3
Samsung
72.3
69.8
72.0
76.3
78.2
Huawei#
52.0
59.7
59.1
56.6
66.8
Apple
46.9
65.9
42.0
36.5
44.8
Oppo
33.9
31.3
25.7
30.6
32.3
Xiaomi
33.3
25.6
27.8
32.3
31.7
vivo
30.5
26.5
23.9
27.0
31.3
Realme
1.2
3.3
2.8
5.0
10.2
Others
109.7
112.6
87.7
92.8
84.7
#Huawei includes HONOR.
*Ranking is according to latest quarter.
Click here to read the about global smartphone market in Q3 2019.
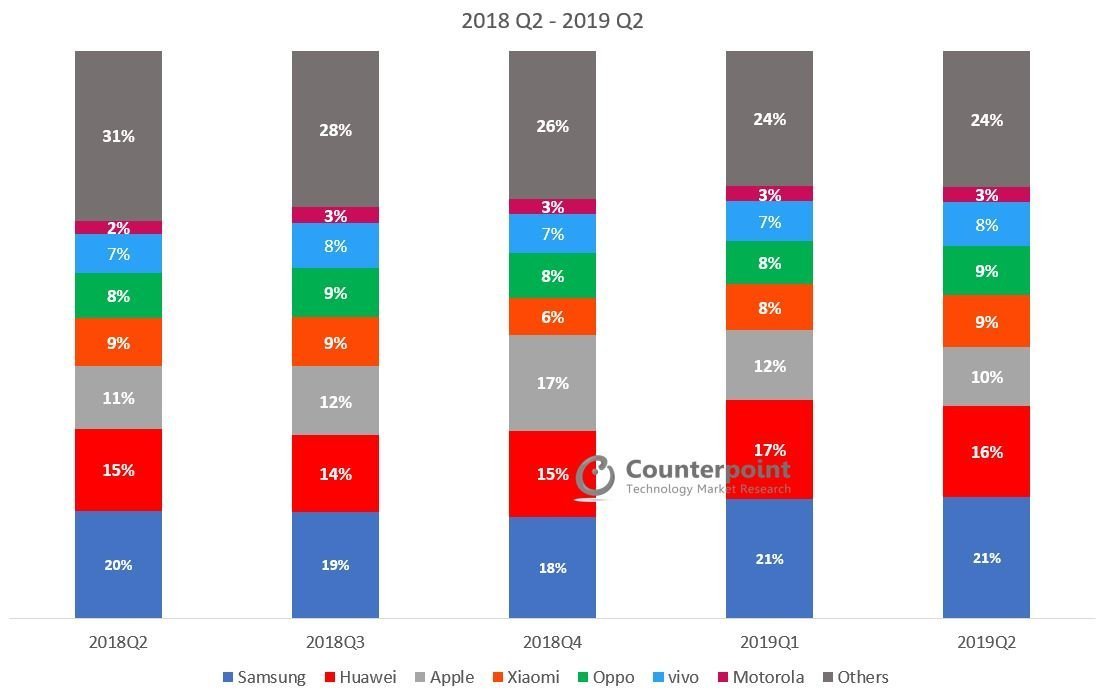
Q2 2019 Highlights
- Samsung grew 7.1% YoY, capturing over one-fifth of the global smartphone market share.
- Huawei grew 4.6% YoY, but the US trade ban will its growth momentum, especially in the overseas market.
- Apple iPhone shipments fell 11%, and iPhone revenues fell 12% year-on-year.
- Realme entered the top 10 OEMs globally for the first time. It took Realme only a year to achieve this feat.
Source: Counterpoint Research Market Monitor
[Global Smartphone Share(%)]
Global Smartphone Shipments Market Share (%)
2018
Q2
2018
Q3
2018
Q4
2019
Q1
2019
Q2
Samsung
20%
19%
18%
21%
21%
Huawei#
15%
14%
15%
17%
16%
Apple
11%
12%
17%
12%
10%
Xiaomi
9%
9%
6%
8%
9%
Oppo
8%
9%
8%
8%
9%
vivo
7%
8%
7%
7%
8%
Lenovo**
2%
3%
3%
3%
3%
Others
31%
28%
26%
24%
24%
[Global Smartphone Shipments (Millions of Units)]
Global Smartphone Shipments
2018
Q2
2018
Q3
2018
Q4
2019
Q1
2019
Q2
Samsung
71.5
72.3
69.8
72.0
76.3
Huawei#
54.2
52.0
59.7
59.1
56.6
Apple
41.3
46.9
65.9
42.0
36.5
Xiaomi
32.0
33.3
25.6
27.8
32.3
Oppo
29.6
33.9
31.3
25.7
30.6
vivo
26.5
30.5
26.5
23.9
27.0
Lenovo**
9.0
11.0
10.1
9.5
9.5
Others
100.2
99.9
105.7
81.0
85.2
#Huawei includes HONOR.
**Lenovo includes Motorola.
*Ranking is according to latest quarter.
Q1 2019 Highlights
- Overall smartphone shipment declined 5% in Q1 2019, Sixth consecutive quarter of shipments falling.
- Samsung recorded an increase in revenue as Galaxy S10 flagship smartphones did better than Galaxy S9 at the time of launch.
- Apple iPhone shipments declined year-over-year for the second consecutive quarter.
- Xiaomi smartphone shipments declined annually as it faces tough competition in the China market.
Source: Counterpoint Research Market Monitor
[Global Smartphone Share(%)]
Global Smartphone Shipments Market Share (%)
2018
Q1
2018
Q2
2018
Q3
2018
Q4
2019
Q1
Samsung
22%
20%
19%
18%
21%
Huawei#
11%
15%
14%
15%
17%
Apple
14%
11%
12%
17%
12%
Xiaomi
8%
9%
9%
6%
8%
Oppo
7%
8%
9%
8%
8%
vivo
5%
7%
8%
7%
7%
Motorola
2%
2%
3%
2%
3%
Others
31%
31%
28%
27%
24%
[Global Smartphone Shipments (Millions of Units)]
Global Smartphone Shipments
2018
Q1
2018
Q2
2018
Q3
2018
Q4
2019
Q1
Samsung
78.2
71.5
72.3
69.8
72.0
Huawei#
39.3
54.2
52.0
59.7
59.1
Apple
52.2
41.3
46.9
65.9
42.0
Xiaomi
28.1
32.0
33.3
25.6
27.8
Oppo
24.2
29.6
33.9
31.3
25.7
vivo
18.9
26.5
30.5
26.5
23.9
Motorola
7.6
8.3
10.6
9.5
8.9
Others
113.1
100.9
100.4
106.4
81.6
#Huawei includes HONOR.
*Ranking is according to latest quarter.
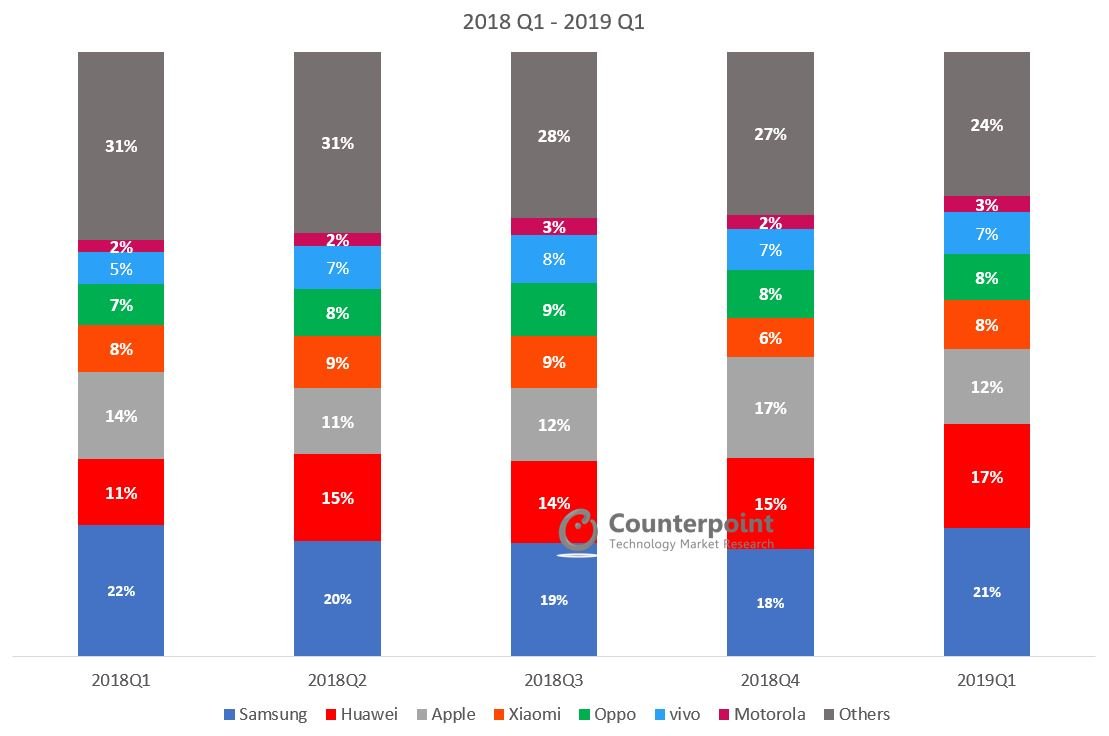
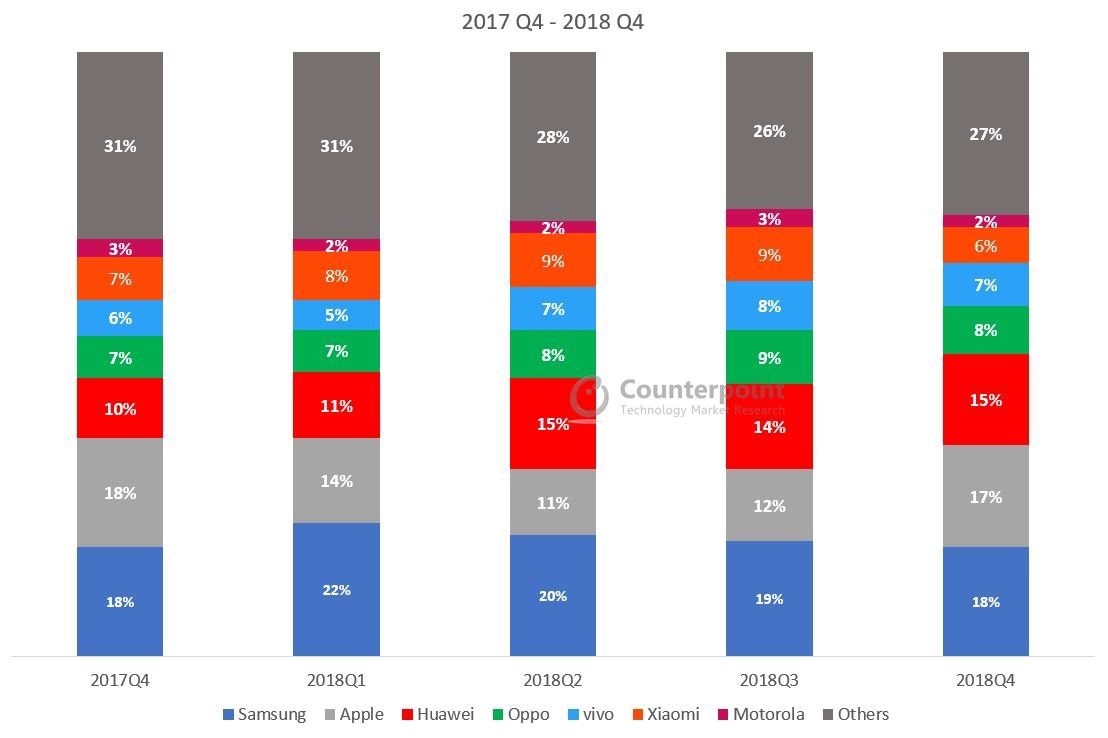
Q4 2018 Highlights
- Q4 2018 smartphone shipments declines 7%; Fifth consecutive quarter of smartphone decline
- For Q4 2018, Huawei, OPPO and vivo continue to dominate with strong performances in China, India, Asia and parts of Europe. The trio have multiple regions to enter and grow moving forward into 2019.
- Samsung and Apple saw a tough quarter and tough 2018 as demand for their flagship phones have waned due to competition from affordable premium and more cutting-edge phones from Chinese brands such as Huawei and OnePlus.
- Xiaomi reached a record fourth position for the full year after two years of setbacks thanks to immense growth in India. It has surpassed OPPO globally to take back the fourth position.
 Source: Counterpoint Research Market Monitor
[Global Smartphone Share(%)]
Global Smartphone Shipments Market Share (%)
2017
Q4
2018
Q1
2018
Q2
2018
Q3
2018
Q4
Samsung
18%
22%
20%
19%
18%
Apple
18%
14%
11%
12%
17%
Huawei
10%
11%
15%
14%
15%
Oppo
7%
7%
8%
9%
8%
vivo
6%
5%
7%
8%
7%
Xiaomi
7%
8%
9%
9%
6%
Motorola
3%
2%
2%
3%
2%
Others
31%
31%
28%
26%
27%
[Global Smartphone Shipments (Millions of Units)]
Global Smartphone Shipments
2017
Q4
2018
Q1
2018
Q2
2018
Q3
2018
Q4
Samsung
74.4
78.2
71.5
72.3
69.8
Apple
77.3
52.2
41.3
46.9
65.9
Huawei
41.0
39.3
54.2
52.0
59.7
Oppo
30.7
24.2
29.6
33.9
31.3
vivo
24.0
18.9
26.5
30.5
26.5
Xiaomi
31.0
28.1
32.0
33.3
25.6
Motorola
10.9
7.6
8.3
10.6
9.5
Others
134.8
113.1
100.9
100.4
106.4
*Ranking is according to latest quarter.
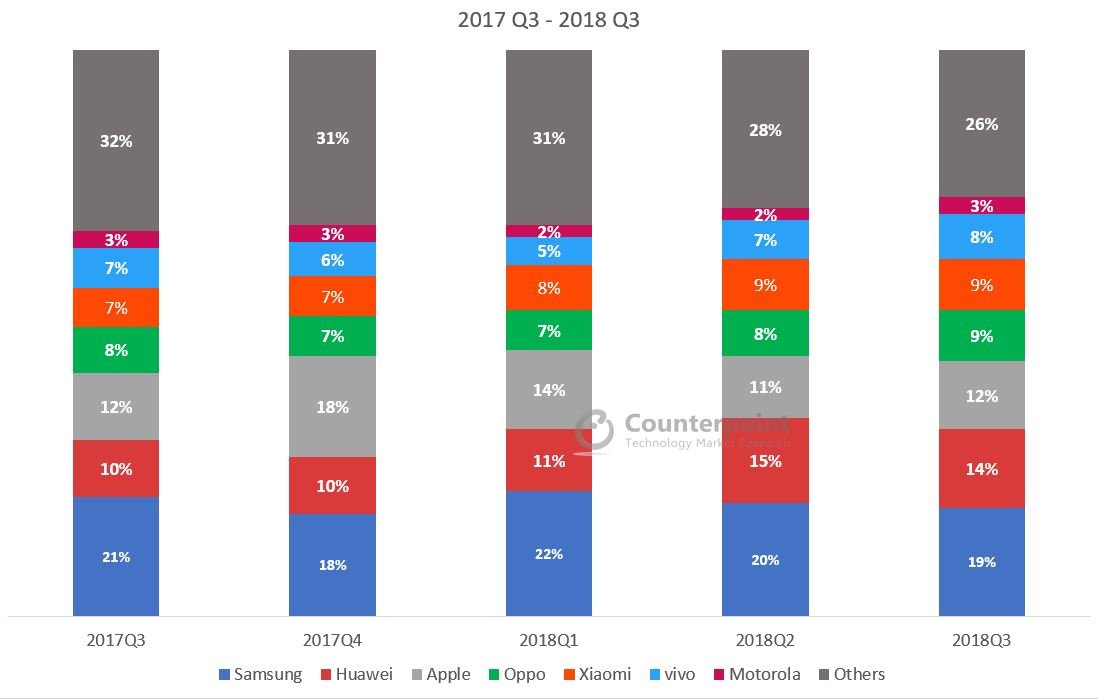
Q3 2018 Highlights
- The top 10 players now capture 79% of the market leaving 600+ brands to compete for the remaining 21% of the market.
- iPhone helped Apple to record 3rd quarter revenue even as shipments remain flat YoY.
- Samsung continued to lead the smartphone market with 19% market share in the quarter.
Source: Counterpoint Research Market Monitor
[Global Smartphone Share(%)]
Global Smartphone Shipments Market Share (%)
2017
Q3
2017
Q4
2018
Q1
2018
Q2
2018
Q3
Samsung
21%
18%
22%
20%
19%
Huawei
10%
10%
11%
15%
14%
Apple
12%
18%
14%
11%
12%
Oppo
8%
7%
7%
8%
9%
Xiaomi
7%
7%
8%
9%
9%
vivo
7%
6%
5%
7%
8%
Motorola
3%
3%
2%
2%
3%
Others
32%
31%
31%
28%
26%
[Global Smartphone Shipments (Millions of Units)]
Global Smartphone Shipments
2017
Q3
2017
Q4
2018
Q1
2018
Q2
2018
Q3
Samsung
83.3
74.4
78.2
71.5
72.3
Huawei
39.1
41.0
39.3
54.2
52.0
Apple
46.7
77.3
52.2
41.3
46.9
Oppo
32.5
30.7
24.2
29.6
33.9
Xiaomi
28.5
31.0
28.1
32.0
33.3
vivo
28.6
24.0
18.9
26.5
30.5
Motorola
12.5
10.9
7.6
8.3
10.6
Others
127.6
134.8
113.1
101.0
100.4
*Ranking is according to latest quarter.
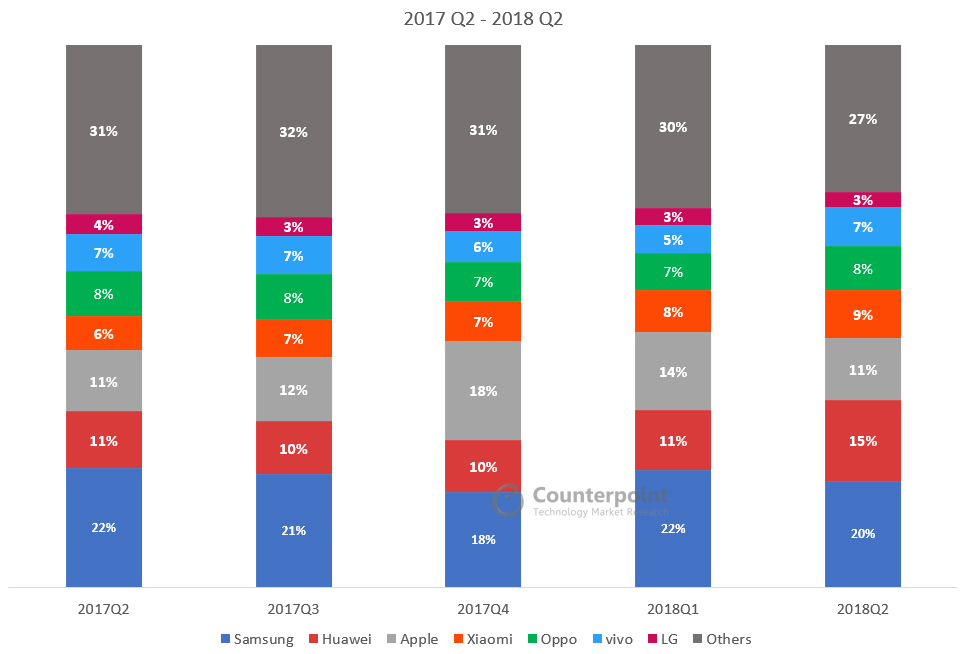
Q2 2018 Highlights
- Smartphone shipments declined 2% annually to 360 million units in Q2 2018.
- The top 10 brands accounted for 79% of the smartphone volumes in Q2 2018.
- Samsung led the smartphone market by volume with a market share of 20% in Q2 2018 even though it registered an annual decline of 11% due to weak sales of its flagship Galaxy S9 series smartphones.
- Huawei shipments grew 41% annually in Q2 2018. The company managed to be the fastest growing (21%) smartphone brand amid a declining China smartphone market and grew fully 71% overseas.
- Apple shipped 41.3 million iPhones during Q2 2018, up 1% compared to the same quarter last year. iPhone X remains the top seller for Apple during the quarter.
 Source: Counterpoint Research Market Monitor
[Global Smartphone Share(%)]
Global Smartphone Shipments Market Share (%)
2017
Q2
2017
Q3
2017
Q4
2018
Q1
2018
Q2
Samsung
22%
21%
18%
22%
20%
Huawei
11%
10%
10%
11%
15%
Apple
11%
12%
18%
14%
11%
Xiaomi
6%
7%
7%
8%
9%
Oppo
8%
8%
7%
7%
8%
vivo
7%
7%
6%
5%
7%
LG
4%
3%
3%
3%
3%
Others
31%
32%
31%
30%
27%
[Global Smartphone Shipments (Millions of Units)]
Global Smartphone Shipments
2017
Q2
2017
Q3
2017
Q4
2018
Q1
2018
Q2
Samsung
80.4
83.3
74.4
78.2
71.5
Huawei
38.5
39.1
41.0
39.3
54.2
Apple
41.0
46.7
77.3
52.2
41.3
Xiaomi
23.1
28.5
31.0
28.1
32.0
Oppo
30.5
32.5
30.7
24.2
29.6
vivo
24.8
28.6
24.0
18.9
26.5
LG
13.3
13.9
13.9
11.4
9.8
Others
113.9
126.3
131.8
109.3
99.5
*Ranking is according to latest quarter.
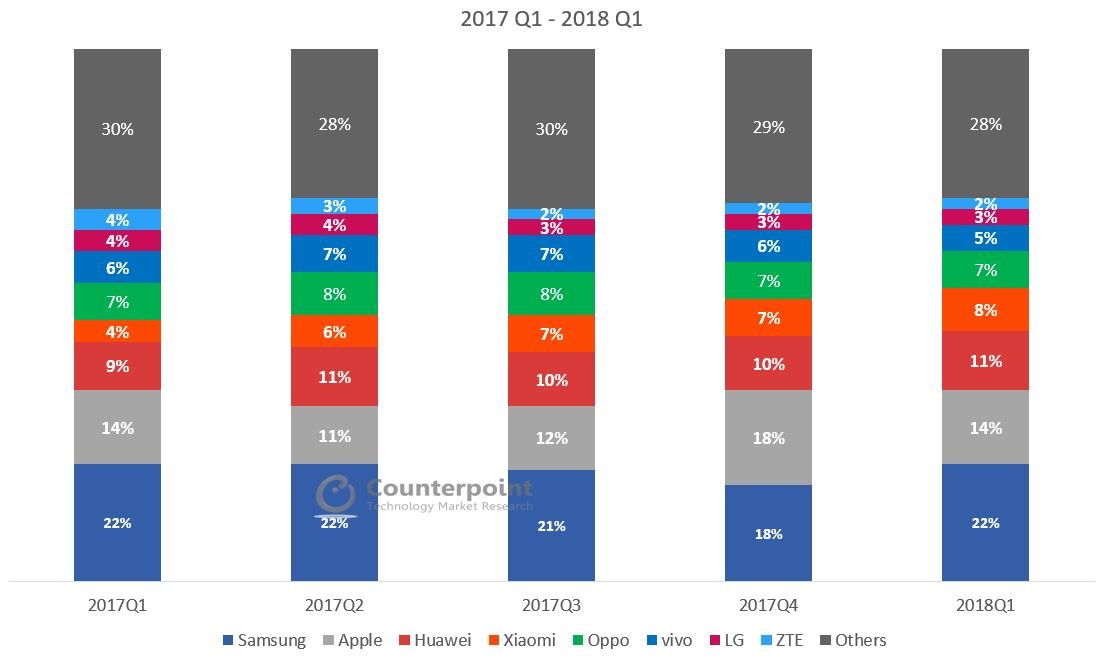
Q1 2018 Highlights
- Smartphone shipments declined 3% annually reaching 360 million units in Q1 2018.
- The China market decline in Q1 2018, affected the overall growth of some of the key Chinese brands including OPPO and vivo. Both saw a decline in the quarter as a result of the China market slowdown.
- Smartphone penetration fell to 76% of all the mobile phones shipped in the quarter. This was partly due to an increase in feature phone shipments by some key brands such as Nokia HMD and Reliance Jio who both saw YoY growth.
- Top 10 brands accounted for 76% of the smartphone volumes in Q1 2018.
 Source: Counterpoint Research Market Monitor
[Global Smartphone Share(%)]
Global Smartphone Shipments Market Share (%)
2017
Q1
2017
Q2
2017
Q3
2017
Q4
2018
Q1
Samsung
22%
22%
21%
18%
22%
Apple
14%
11%
12%
18%
14%
Huawei
9%
11%
10%
10%
11%
Xiaomi
4%
6%
7%
7%
8%
Oppo
7%
8%
8%
7%
7%
vivo
6%
7%
7%
6%
5%
LG
4%
4%
3%
3%
3%
ZTE
4%
3%
2%
2%
2%
Others
30%
28%
30%
29%
28%
[Global Smartphone Shipments (Millions of Units)]
Global Smartphone Shipments
2017
Q1
2017
Q2
2017
Q3
2017
Q4
2018
Q1
Samsung
80.0
80.4
83.3
74.4
78.2
Apple
50.8
41.0
46.7
77.3
52.2
Huawei
34.6
38.5
39.1
41.0
39.3
Xiaomi
13.4
23.1
28.5
31.0
28.1
Oppo
26.1
30.5
32.5
30.7
24.2
vivo
22.8
24.8
28.6
24.0
18.9
LG
14.8
13.3
13.9
13.9
11.4
ZTE
13.3
12.2
9.8
9.4
7.1
Others
115.4
101.8
116.5
122.5
102.2


![Toni Kroos là ai? [ sự thật về tiểu sử đầy đủ Toni Kroos ]](https://evbn.org/wp-content/uploads/New-Project-6635-1671934592.jpg)


