Cisco Content Hub – Troubleshooting VoWLAN using OmniPeek
Mục Lục
Capturing Data for Wireless Analysis
To troubleshoot VoWLAN, we must first capture
the wireless data carrying the VoWLAN information. Capturing data
for wireless analysis can be broken down into two main categories:
portable and distributed. The type of data captured and retained
varies depending on the intended use of the data. OmniPeek is
designed for troubleshooting and root cause analysis, therefore it
captures and stores every 802.11 packet.
Portable Analysis
Portable analysis requires that the analyst
be present at the source of data collection with the appropriate
hardware and software to perform the analysis. Portable analysis
using OmniPeek is typically done with a laptop computer running
OmniPeek Professional or OmniPeek Enterprise, using one or more
supported wireless adapters.
Distributed Analysis
Distributed analysis allows the analyst to
collect data from remote locations and analyze the data locally.
This eliminates costly visits to remote locations for portable
analysis. WildPackets supports two primary methods for distributed
analysis.
AP Remote Adapters
The AP Remote Adapter provides connectivity
between OmniPeek and Cisco LWAPP/CAPWAPs over a wired network.
Using the control software for the managed wireless switch, first
choose which access point(s) to use as packet capture devices. Once
selected, set the channel to be used and then specify the IP
address where OmniPeek is running. This is the IP address that the
AP(s) will send the packets to. Now configure OmniPeek to receive
the packet stream by starting a new capture and setting the Cisco
Remote Adapter properties in the Capture Options dialog box as shown below.
Figure 6-1 Capture Options
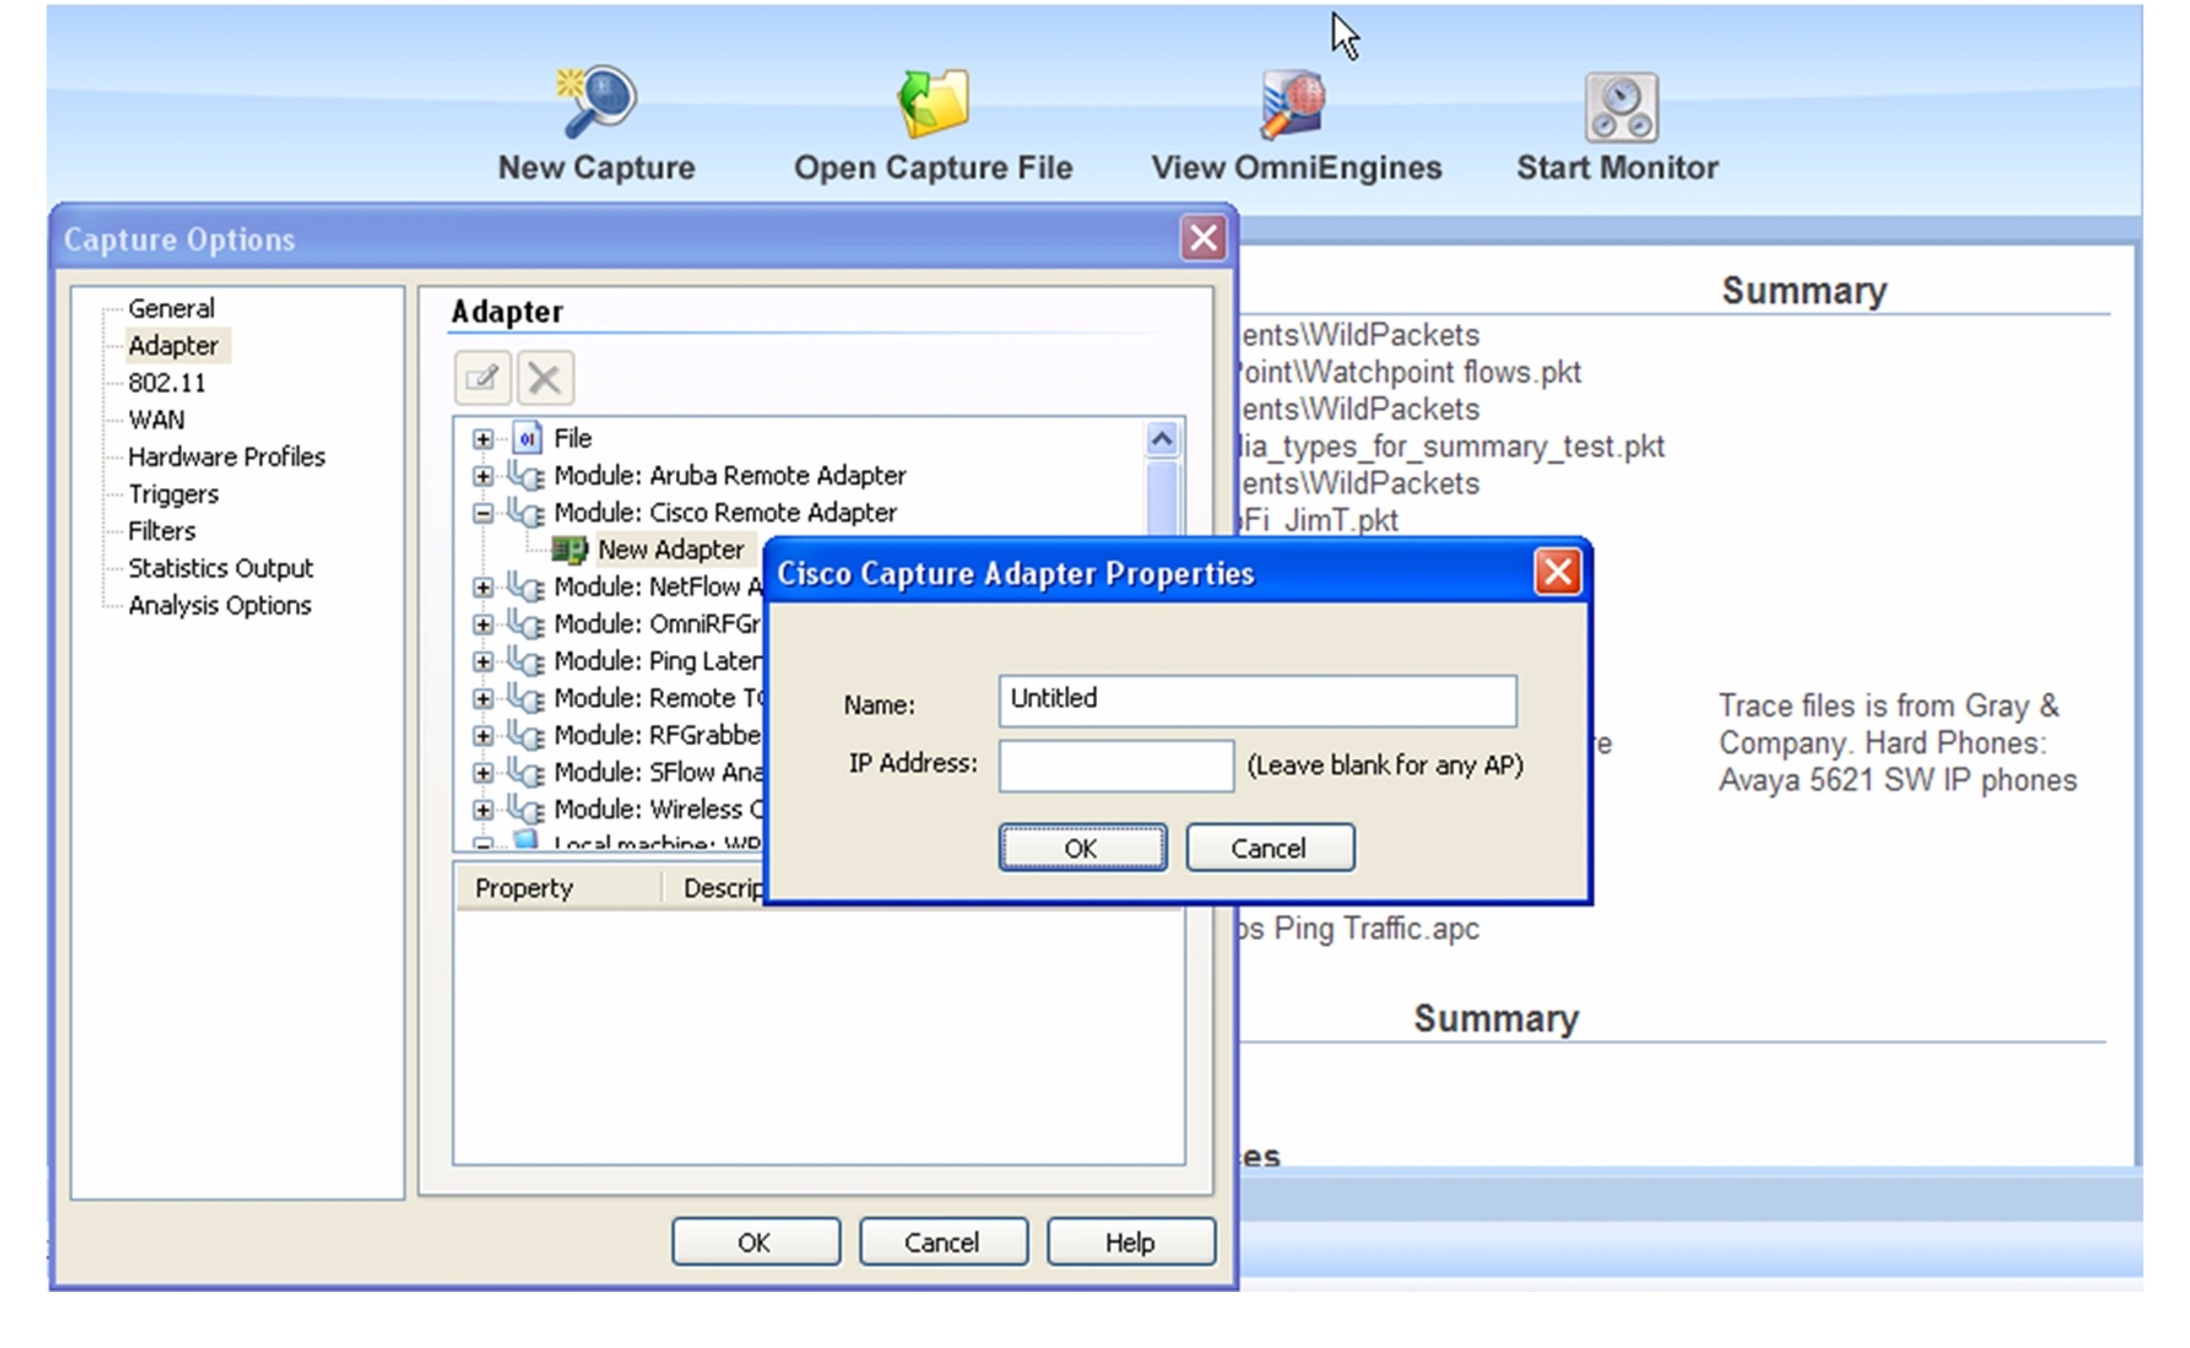
Name: Provide a unique
name for the remote adapter.
IP Address: Providing an
IP address means OmniPeek will accept only packets from that IP
address. If this field is left blank, OmniPeek will accept packets
from any AP that sends packets to the IP address of the computer
running OmniPeek.
Set any other capture parameters and click
OK. Then click Start once
the OmniPeek capture screen is shown.
For a video guide of this procedure, see
http://www.wildpackets.com/ciscoapgrabber_video.
OmniEngines
OmniEngines provide data capture and analysis
24 hours a day without requiring ongoing monitoring by the analyst.
OmniEngines are Windows software or Linux appliances (Omnipliances)
that are designed for continuous, remote operation. For wireless
analysis, supported wireless adapters need to be added to enable
wireless capture. OmniEngines are remotely controlled using
OmniPeek as a console. Use the OmniPeek UI to configure and start
the capture on the OmniEngine. All data is then captured, analyzed
and stored by the OmniEngine, with no data sent over the wired
network. All results from the OmniEngine analysis can be viewed
using the OmniPeek console.
Optimizing Analysis for Wireless
OmniPeek is designed for a wide range of
analysis tasks, but very often only a limited set of analysis
options are pertinent to the task at hand. Following are guidelines
for configuring various analysis options to optimize performance
for wireless analysis.
Analysis Options
The analysis capabilities of OmniPeek are
broken down into functional options. It is often the case that not
all functional analysis options will be needed for the work being
done. Turning off unnecessary analysis options will improve
OmniPeek performance. To view and turn off unneeded analysis
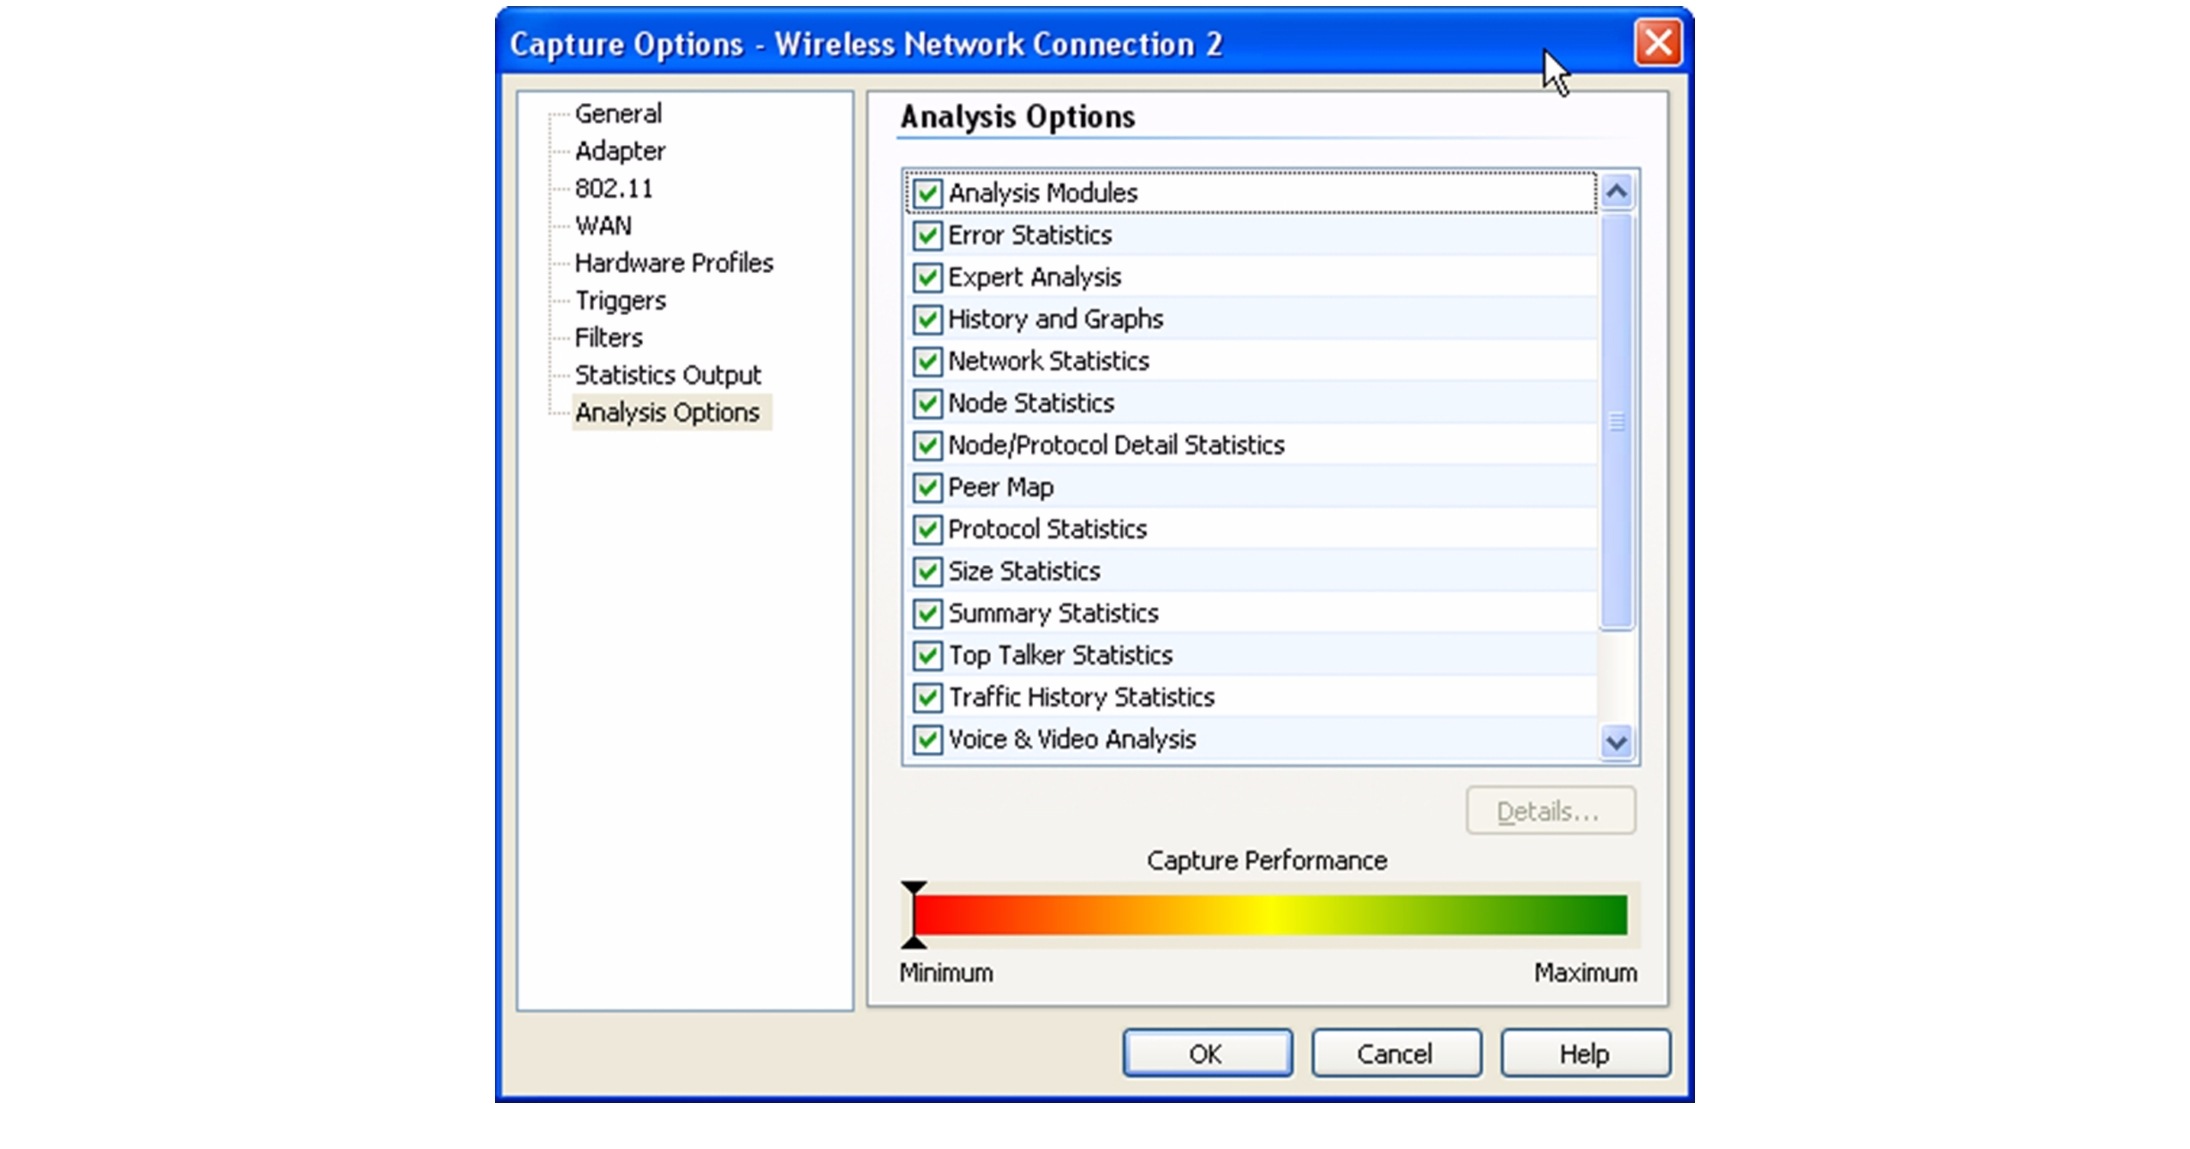
options when starting a new capture, choose Analysis Options from the left-hand navigation in the
Capture Options window. You will see the
following dialog box which you can use to turn off all unneeded
analysis options. Remember to keep Voice & Video Analysis enabled for VoWLAN analysis.
Figure 6-2 Analysis Options

Note ![]() If you later find that you need a certain analysis
If you later find that you need a certain analysis
option that you disabled, and you saved the packet capture files,
just enable the analysis option and open the packet file to see the
newly enabled analysis results.
Expert Event Analysis
In addition to functional analysis options,
OmniPeek continually monitors the network for Expert events,
network anomalies, and suboptimal performance at all layers of the
network, from application to physical. It also shows network events
associated with wireless-specific anomalies and VoIP calls. Each
individual Expert event can be enabled or disabled separately. It
is important to review the Expert events to ensure that events you
want to analyze are enabled. Once a capture is started, choose any
one of the Expert Views from the left-hand navigation of the main
Capture Window, and then click on the
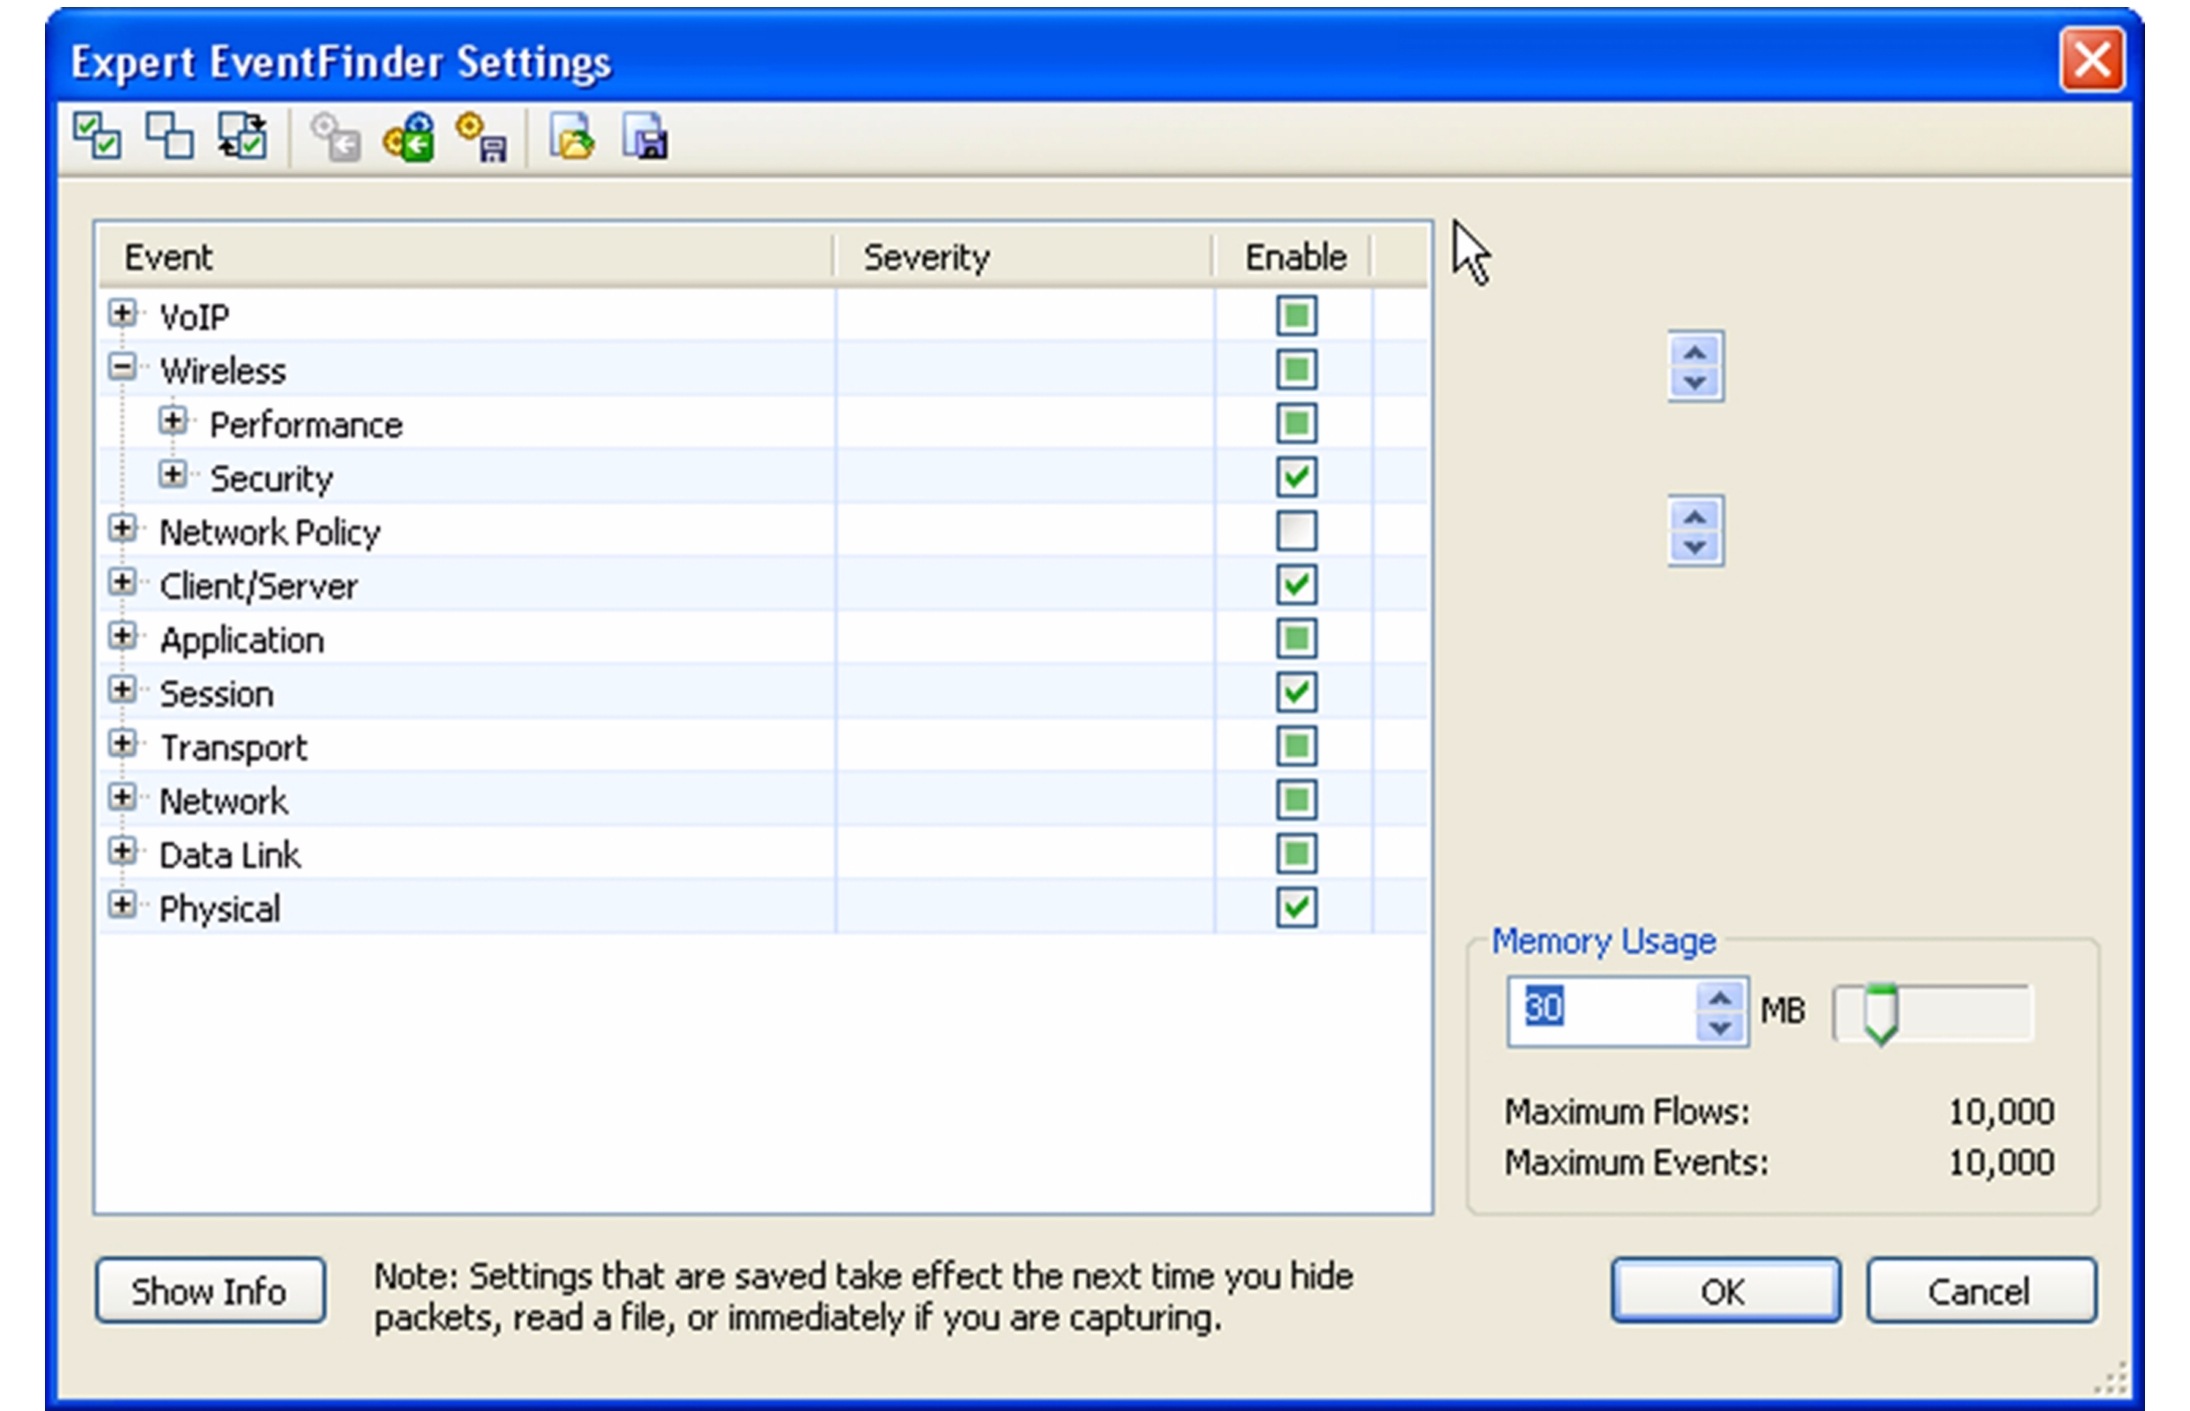
Expert EventFinder Settings icon. The
Expert EventFinder Settings dialog box will
appear, allowing each individual Expert event to be configured and
enabled or disabled. Pay special attention to the VoIP and Wireless
Expert Events, as these can be extremely useful in identifying
VoWLAN issues before they become serious problems.
Figure 6-3 Expert Event Analysis
Multichannel Analysis
Multichannel analysis allows multiple,
simultaneous captures on unique wireless channels with all captured
packets analyzed as if it is a single capture. This is extremely
useful for analyzing situations where users are roaming from
channel to channel, or when it is known where a problem is but not
what channel the wireless client is using. Multichannel analysis
requires the download and installation of the Wireless Channel
Aggregator plug-in from the MyPeek Community Portal (https://mypeek.wildpackets.com/view_submission.php?id=81)
as well as one supported wireless adapter for each channel that
will be analyzed. To configure OmniPeek for multichannel analysis,
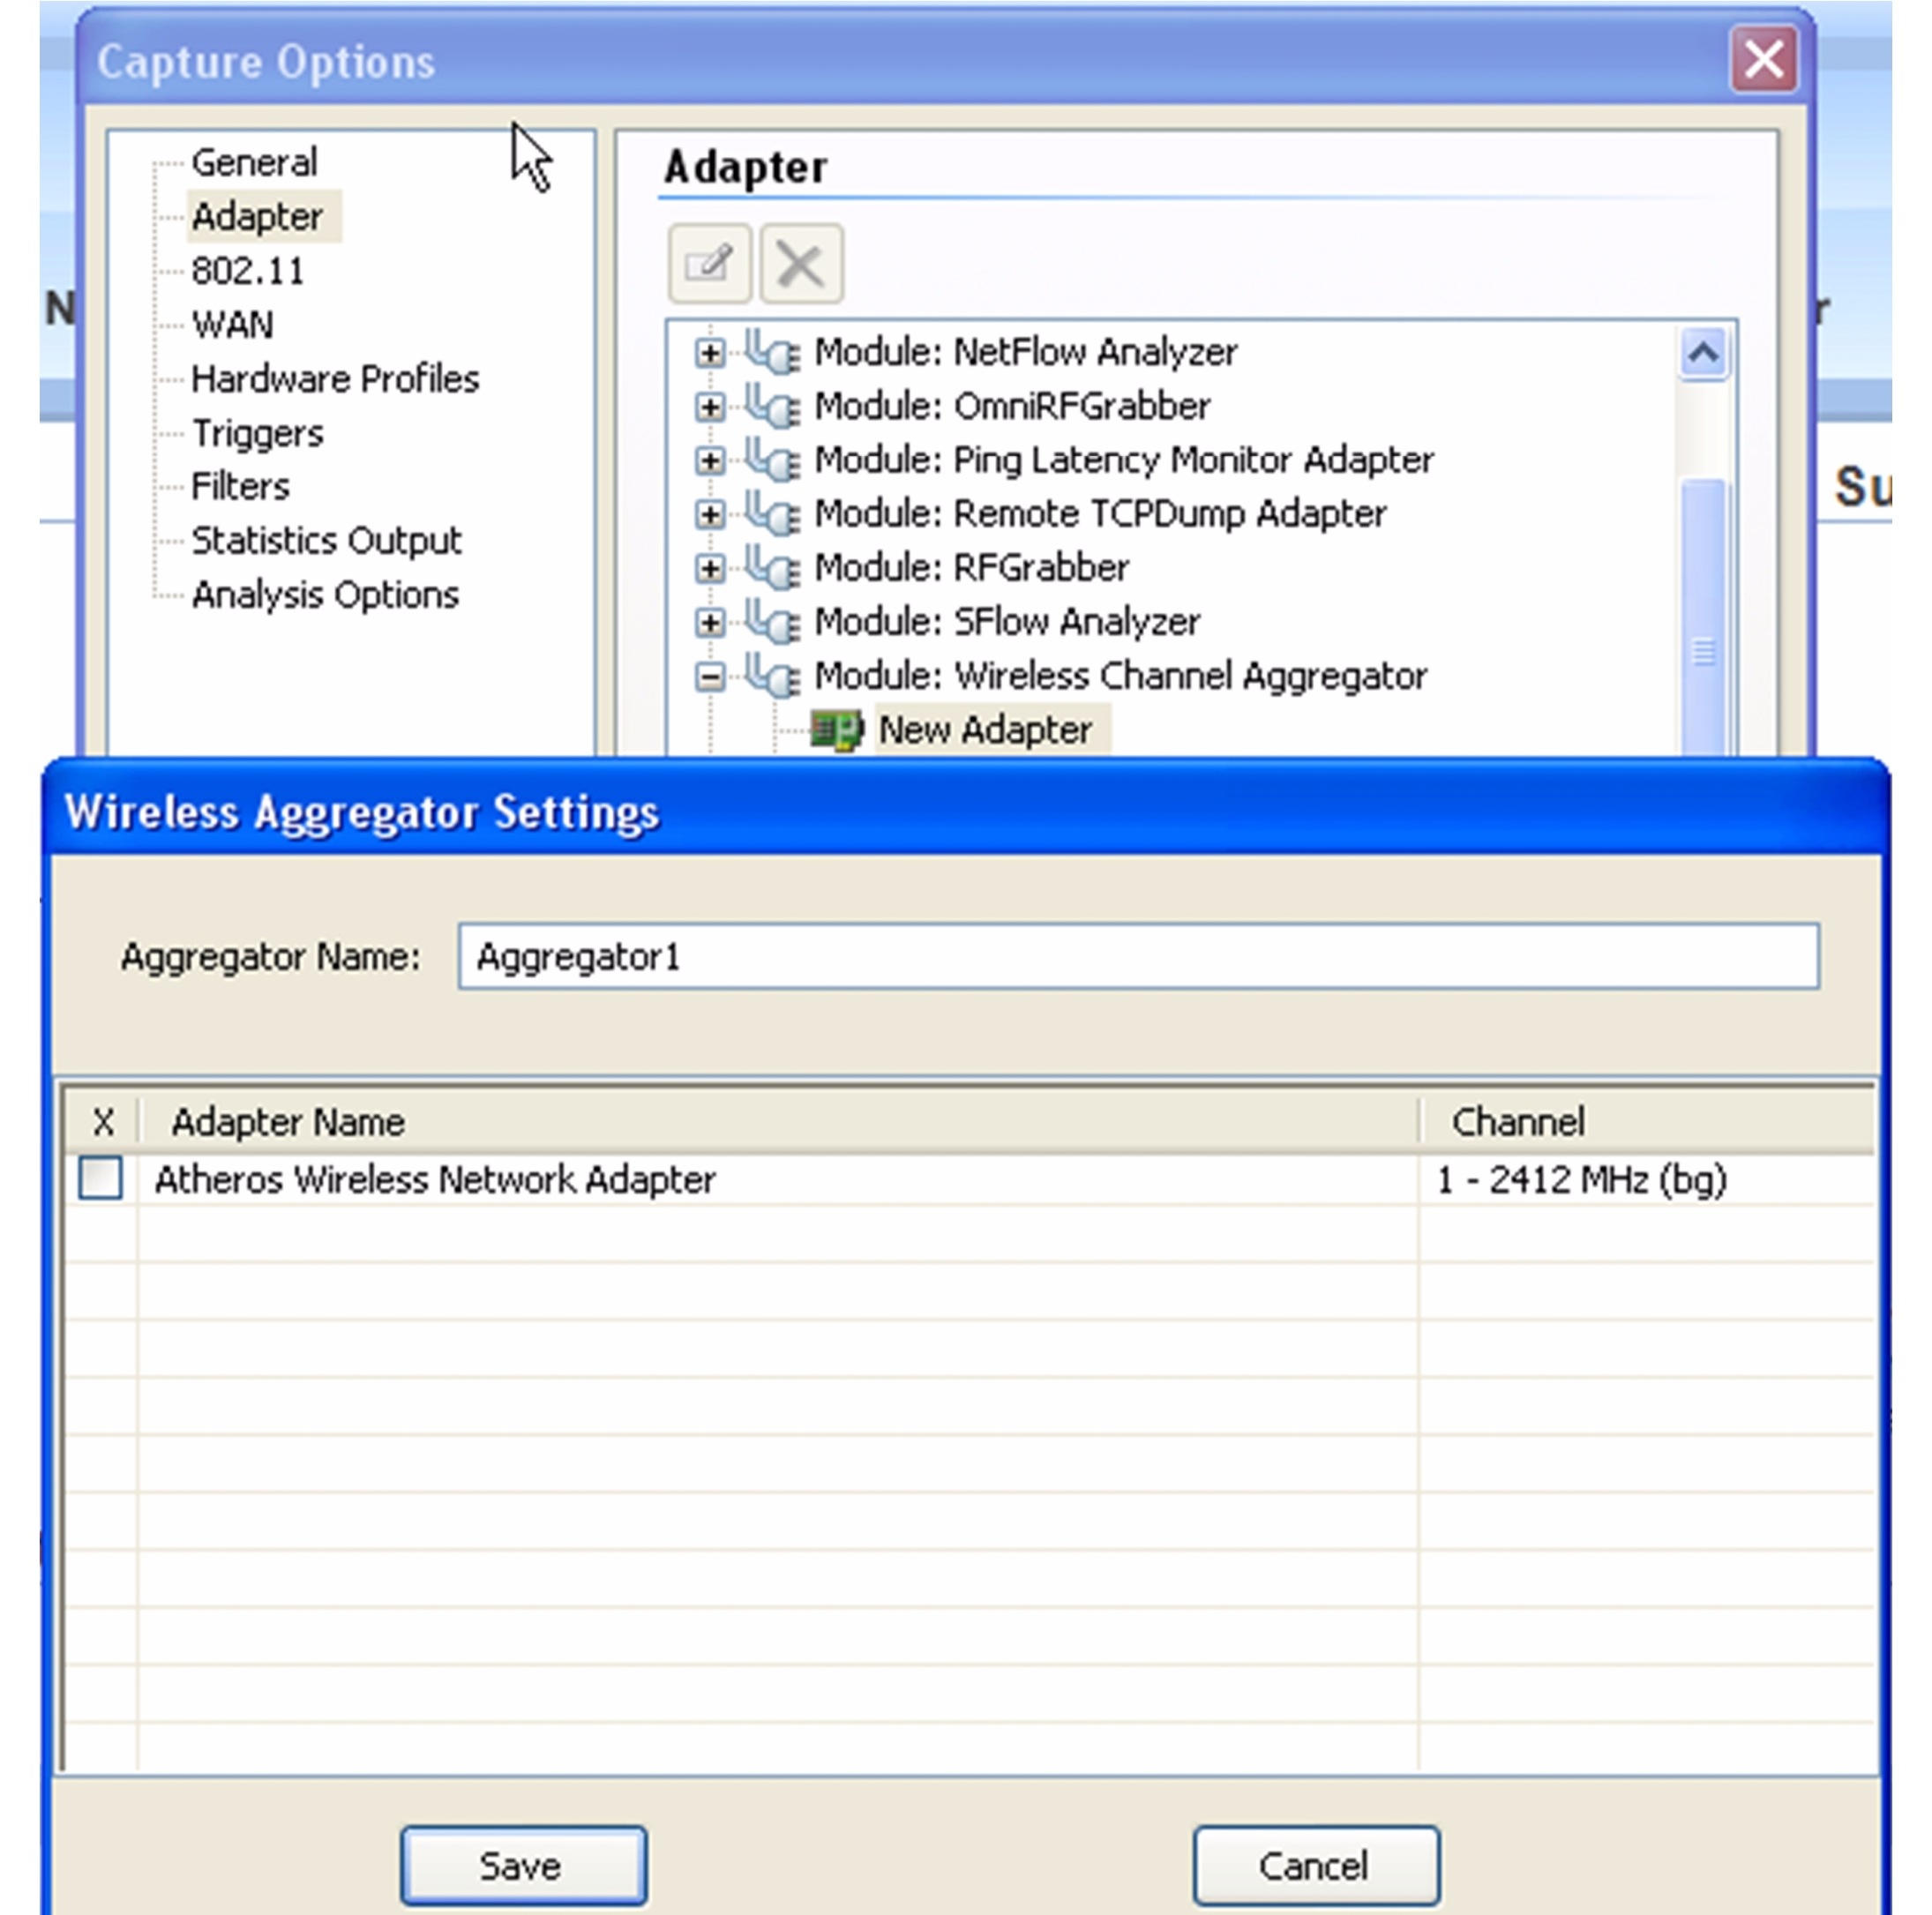
start a new capture and choose Adapter from
the left-hand navigation in the Capture Options dialog box. Expand Module: Wireless Channel Aggregator and choose
New Adapter by double-clicking. Choose the
wireless adapters you wish to use for channel aggregation and set
the channel for each. Click Save, set any
other desired capture options, click OK and
then click Start Capture when the main
Capture Window appears.
Figure 6-4 Multichannel Analysis
Roaming
Roaming analysis provides detailed
information every time a wireless client moves from one AP to
another. Roaming analysis requires multichannel analysis since
roaming typically involves a change in channel, as well as the
download and installation of the Roaming Latency Plug-in from the
MyPeek Community Portal (https://mypeek.wildpackets.com/view_submission.php?id=75).
Once the Roaming Latency Plug-in is installed, it can be used with
all wireless captures. To see the results of any wireless roaming,
go to Roaming in the left-hand navigation of
the main Capture Window and choose the desired
view: Log, by Node or by AP. An example of the by AP view is as follows.
Figure 6-5 Log By AP View


Note ![]() The Roaming Latency Plug-in assumes wireless clients
The Roaming Latency Plug-in assumes wireless clients
are moving from one channel to another. If the capture is for a
single channel, no roaming will be detected or reported. If the
capture is scanning, roaming will be detected and reported but the
latency measurements will not be accurate. For best results the
Roaming Latency Plug-in should be used along with the Wireless
Channel Aggregator.
The VoIP Dashboard
The Voice & Video
dashboard provides a visual summary of voice and video calls,
including VoWLAN calls, as well as useful graphs and statistics to
troubleshoot and analyze voice and video traffic. An example of the
Voice and Video dashboard is as follows.
Figure 6-6 VoIP Dashboard
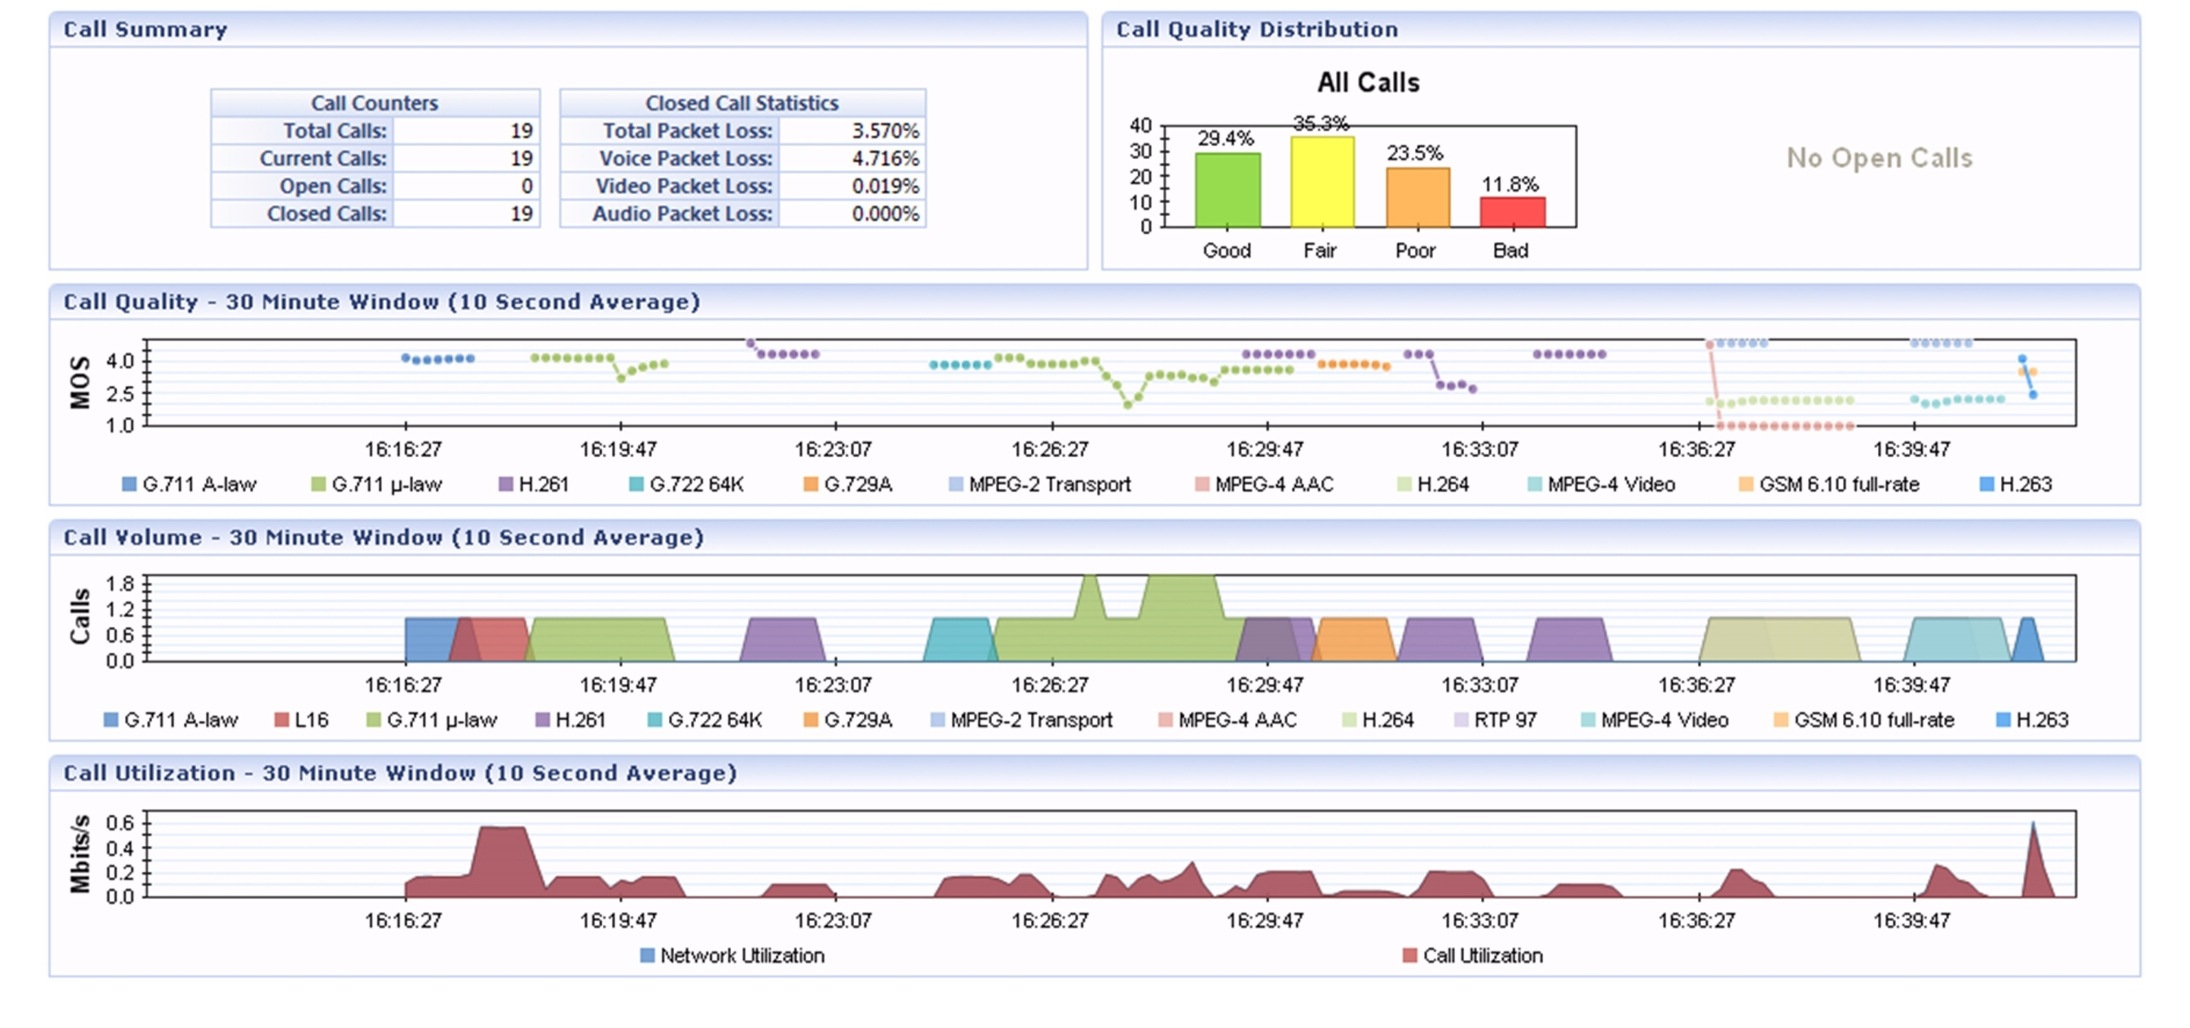
The parts of the Voice & Video dashboard are described below.
•![]() Call Summary: This display shows “Call Counter”
Call Summary: This display shows “Call Counter”
information and “Closed Call Statistics” on voice and video packet
loss.
•![]() Call Quality Distribution: This display shows open and
Call Quality Distribution: This display shows open and
closed calls by quality based on MOS scores. You can right-click
inside the display to select a bar or pie display. Because MOS
scores are based on media flows, and not calls, each call’s quality
is the lowest MOS score of any of its associated media flows. Voice
media is scored with MOS-CQ, video media with MOS-V, and audio
media with MOS-A. The quality thresholds are as follows:
–![]() <2.0 = Bad (displayed in Red)
<2.0 = Bad (displayed in Red)
–![]() >=2.0 to <3.0 = Poor (displayed in Orange)
>=2.0 to <3.0 = Poor (displayed in Orange)
–![]() =3.0 to <4.0 = Fair (displayed in Yellow)
=3.0 to <4.0 = Fair (displayed in Yellow)
–![]() >4.0 = Good (displayed in Green)
>4.0 = Good (displayed in Green)
•![]() Call Quality: This display shows a line graph of the
Call Quality: This display shows a line graph of the
quality for each codec in use over time. You can right-click inside
the display to select a line or line/points graph. MOS scores are
used for the quality measurement. Voice media is scored with
MOS-CQ, video media with MOS-V, and audio media with MOS-A. The
quality for a time period is the average of the MOS scores for all
open media flows for that time period
•![]() Call Volume: This display shows a graph of open calls
Call Volume: This display shows a graph of open calls
(per codec) over time for voice and video calls. This graph
reflects all calls from the Calls and
Media view. You can right-click inside the
display to select an area, line, or line/points graph.
•![]() Call Utilization: This display shows a graph of
Call Utilization: This display shows a graph of
overall network utilization compared to network utilization by VoIP
protocols. You can right-click inside the display to select an
area, line, or line/points graph. This graph displays two legends:
Network Utilization and Call Utilization. Utilization values are
displayed in Mbps. The VoIP utilization is the total utilization
for all VoIP packets (i.e., signaling, media RTP/RTCP and
unsupported codecs).
Detailed VoIP Analysis
Voice and video over IP signaling and media
analysis are included with OmniPeek Enterprise. In OmniPeek, the
unit of communication is the call, and an individual call may be
carried in multiple channels, some dedicated to signaling and
others to carrying the encoded voice data. The encoded data is
referred to as media, and a call containing such data has media
channels. Media channels contain RTP (Real-time Transport Protocol)
or RTCP (RTP Control Protocol) data. The conversion of voice data
into digital form and back again is accomplished using a particular
codec (coder/decoder), specified in the RTP header.
The Voice & Video
views in Capture Windows provide simultaneous
analysis of voice and video traffic with subjective and objective
quality metrics. The Calls view displays one
row for each call in a capture and the Media
view displays one row for each RTP media flow in a call.
The Voice & Video
views have two data areas. The upper pane contains voice and video
data arranged by call or by the media streams within a call. The
lower pane contains three tabs which present additional information
for a row or rows selected in the upper pane, allowing you to view
call details, a summary count of the Expert events found in the
capture, or a capture log of the individual VoIP Expert events.
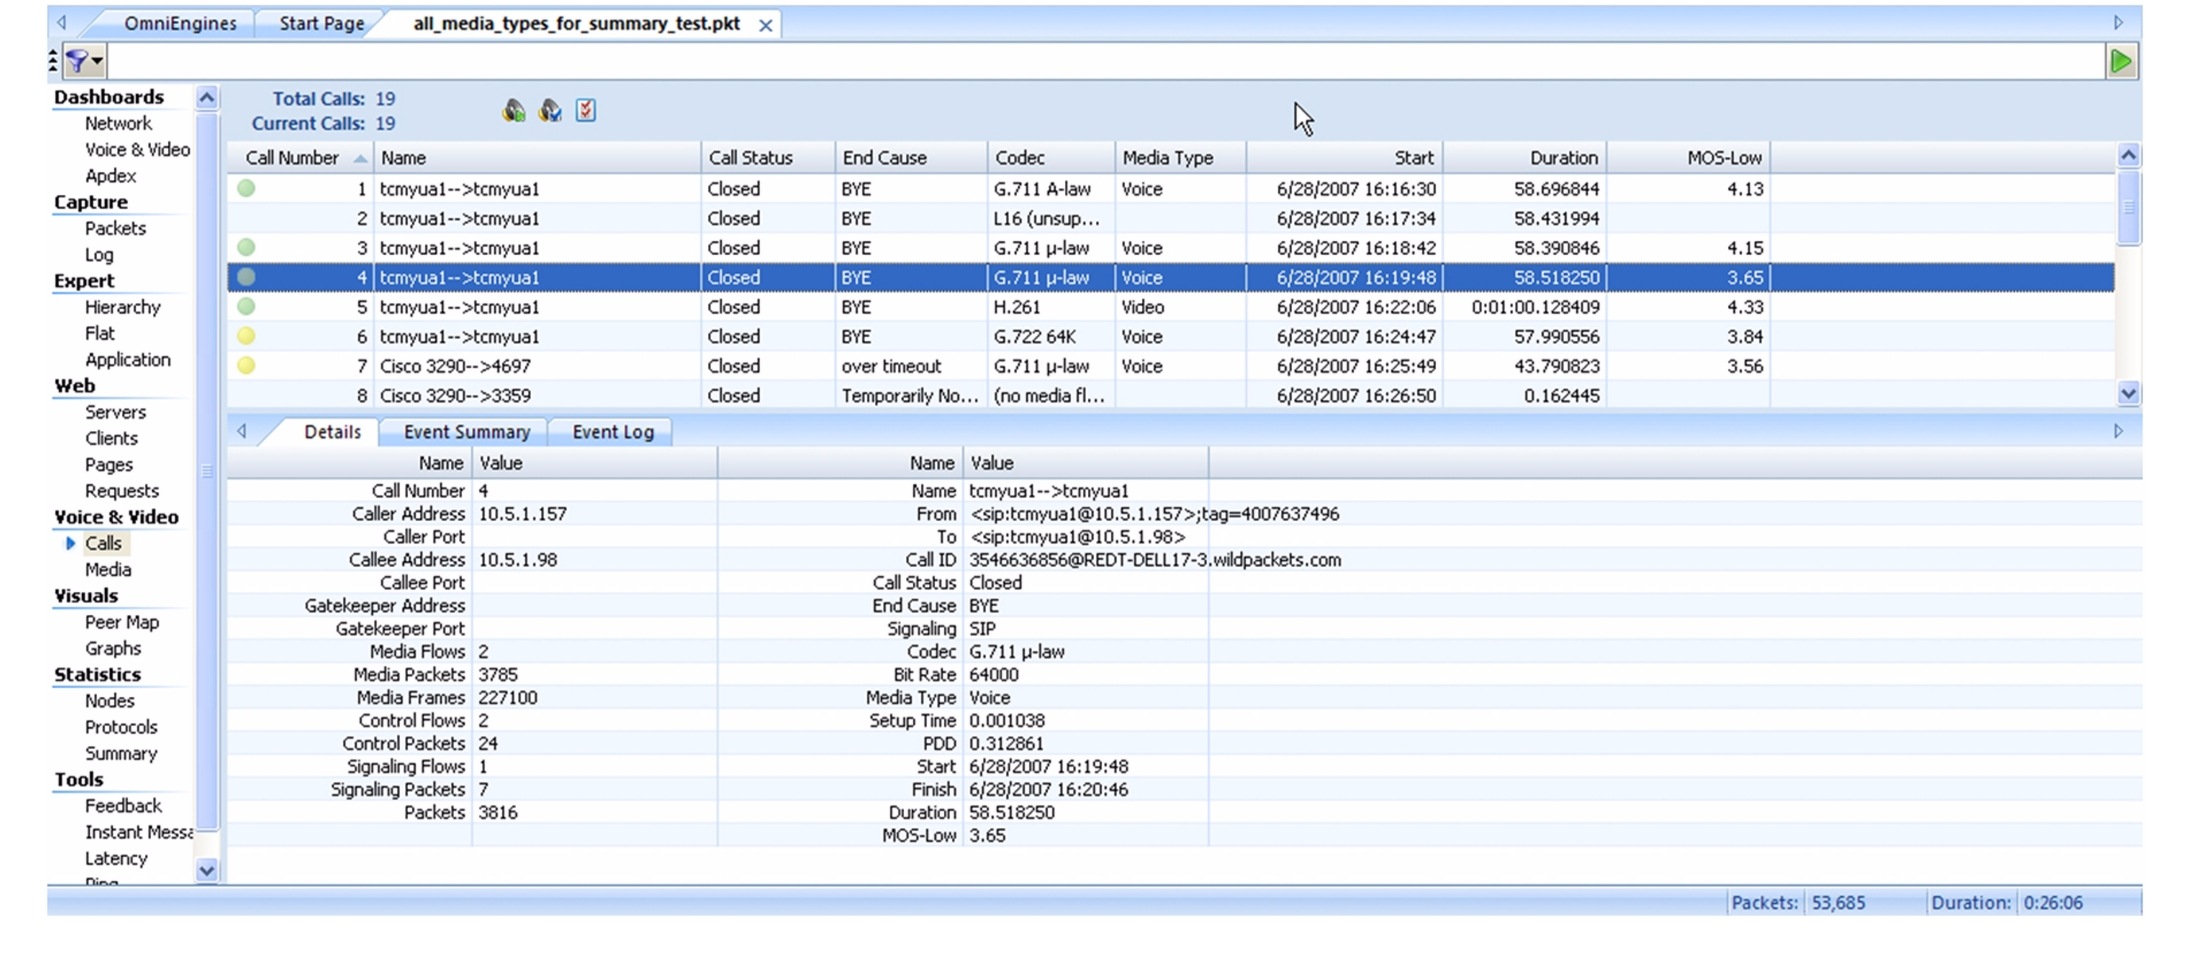
The Calls View
The Calls view displays
one row for each call. Each call is displayed in the order in which
it was captured, with call number, call name, and end cause
information. You can click any column header to sort by that column
data. Right-click the column header to display additional view
columns. An example of the Calls view is as
follows.
Figure 6-7 Calls View
The Media View
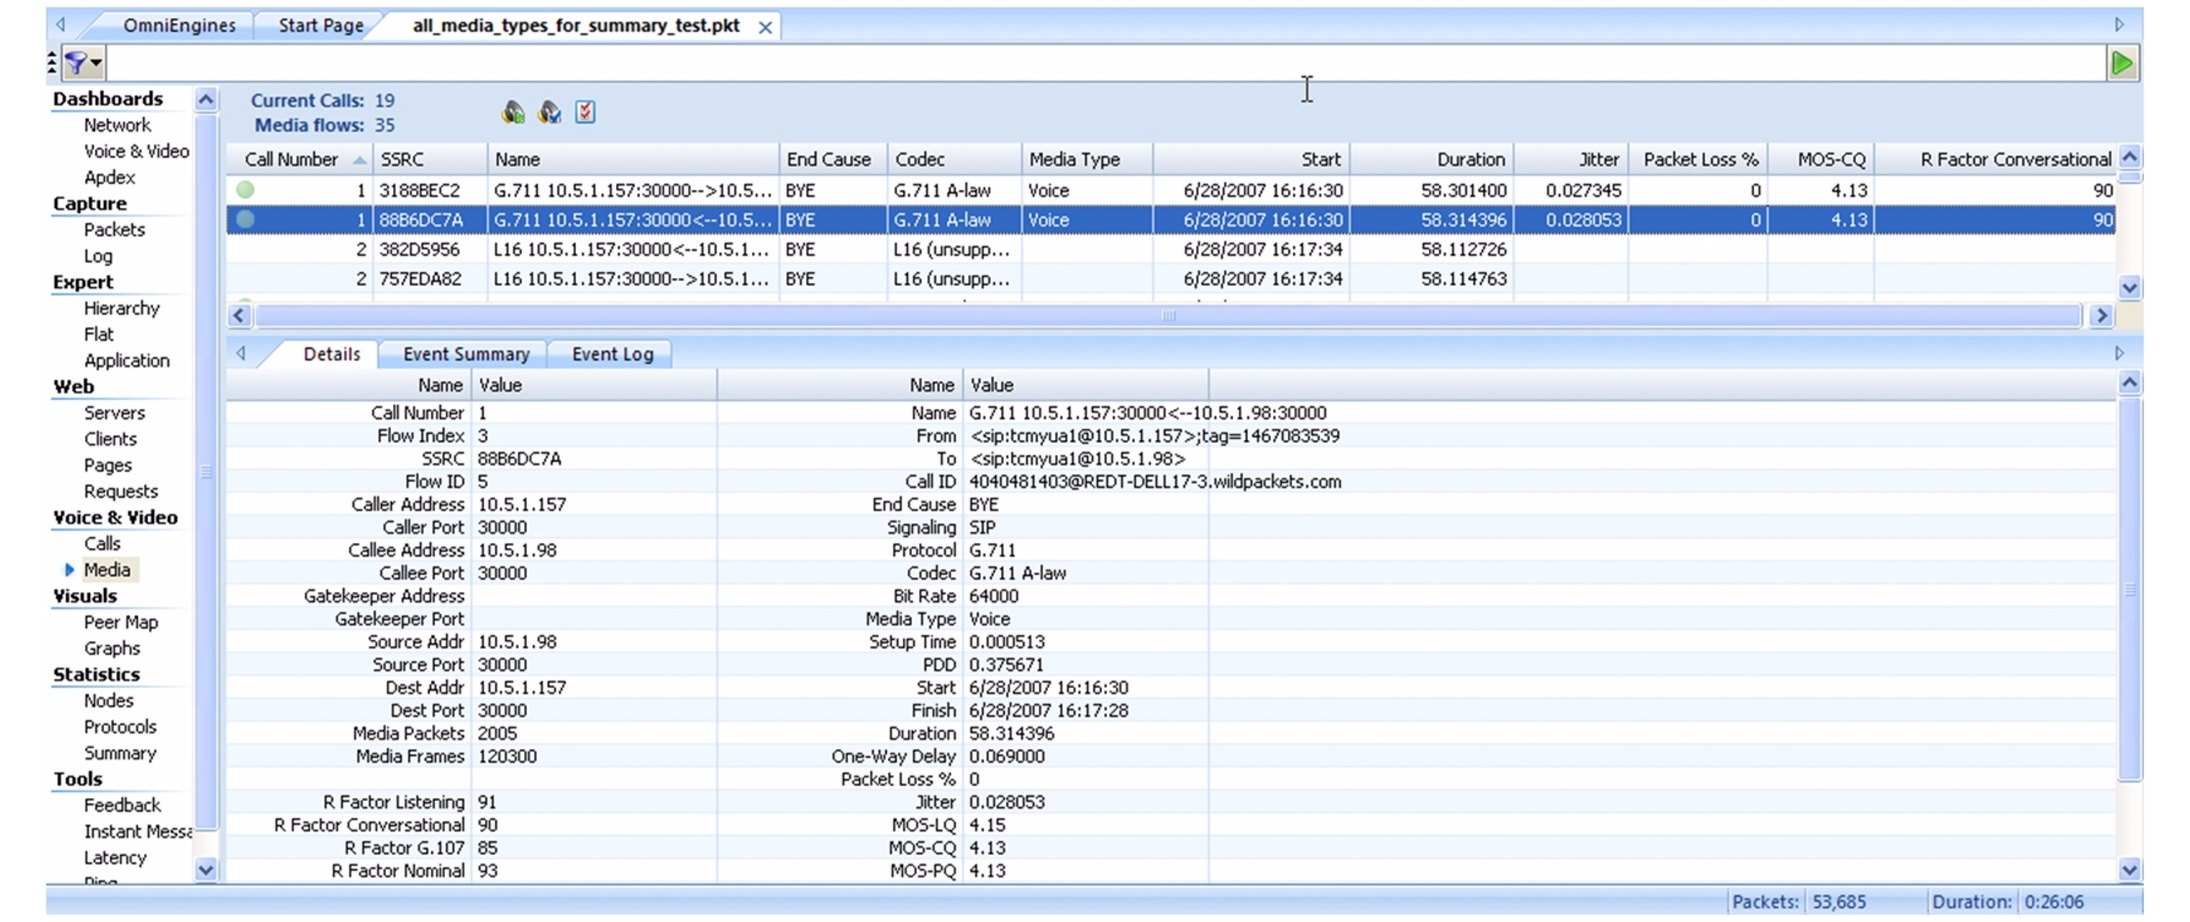
The Media view displays one row for each RTP
media flow in a call. A voice call will usually have two media
flows, one for each direction. Video calls will usually have four
media flows: two voice and two video. You can click any column
header to sort by that column data. Right-click the column header
to display additional view columns. An example of the Media view is as follows.
Figure 6-8 Media View
Voice and Video Visual Expert
The Voice & Video Visual Expert displays each
individual packet of an entire call within a single window, as well
as the RTP packet timing, jitter, and quality score over time. If
there are gaps of missing or late RTP packets, these gaps are also
displayed, along with their effect on call quality.
The Voice & Video Visual Expert window displays a
signal bounce diagram with columns corresponding to each node
participating in the call. Signaling and media stream packets are
represented by horizontal lines, giving you an immediate overview
of the contents of a call. The bounce diagram also includes linear
representations as well as numerical measurements of R-Factor and
jitter values. Right-click the column header to display additional
view columns. An example of the Voice & Video Visual Expert is as follows.
Figure 6-9 Voice and Video Visual Expert
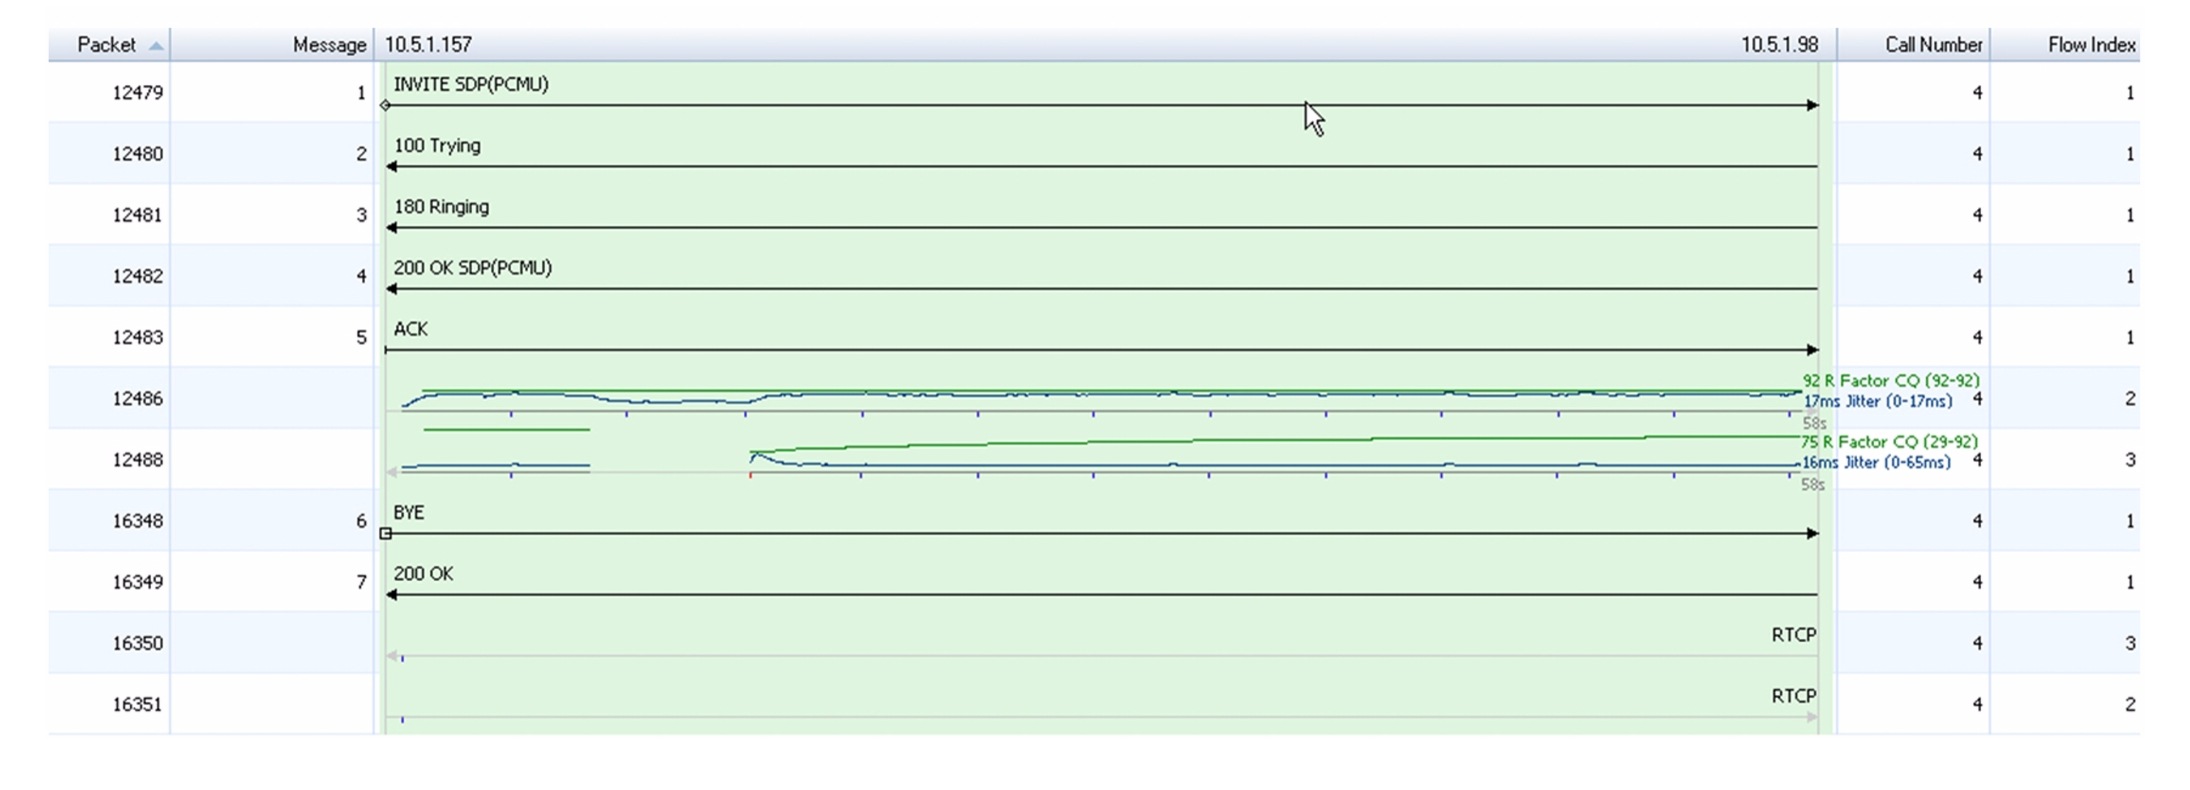
The key for interpreting the various lines
and symbols is as follows.
Signaling Packets:
•![]() Each signaling packet appears as a black horizontal
Each signaling packet appears as a black horizontal
arrow, with a summary above the arrow.
•![]() Packets that start a call (such as SIP INVITE packets)
Packets that start a call (such as SIP INVITE packets)
start with a small diamond.
•![]() Packets that usually mean the end of call setup (such
Packets that usually mean the end of call setup (such
as SIP ACK packets) start with a small bar. The time between these
two packets is the call setup time.
Media (RTP/RTCP) Packets
The media or voice streams (RTP/RTCP packets)
within a call display in the Signaling tab as
rows progressing through time, with the first packet in the row at
the left to the last packet at the right. Since most calls are
bidirectional, a pair of rows often appears with one row for each
direction.
•![]() Gray arrows and numbers: Gray horizontal arrows
Gray arrows and numbers: Gray horizontal arrows
represent the RTP/RTCP media packets. The last packet in the row
displays a small gray number showing the entire duration for the
row.
•![]() Green lines and numbers: Green horizontal lines show
Green lines and numbers: Green horizontal lines show
R-Factor conversational values, with the row’s final value and
minimum-maximum range in green to the right of the last packet in
the row.
•![]() Blue lines and numbers: Blue lines show jitter values,
Blue lines and numbers: Blue lines show jitter values,
with the row’s final value and minimum-maximum range in blue to the
right of the last packet in the row.
•![]() Blue tick marks: Blue tick marks represent RTCP
Blue tick marks: Blue tick marks represent RTCP
packets.
•![]() Gray tick marks: Gray tick marks represent
Gray tick marks: Gray tick marks represent
out-of-sequence RTP packets.
•![]() Red tick marks: Red tick marks show gaps of one or
Red tick marks: Red tick marks show gaps of one or
more missing packets.
Voice Playback
To play the audio, right-click the call or
media flow in the Calls or Media views, and choose Play Audio. (You can also select the call or media flow
and click the Play Audio button in the upper
pane header.) The default media player starts and begins playing
the audio of the selected call.
You can click the Playback Options button to open the Media Playback Options dialog where you can adjust the
jitter buffer settings. A jitter buffer temporarily stores arriving
packets in order to minimize delay variations. If packets arrive
too late, then they are discarded. To make fine adjustments to the
slider bar, click the slider bar and move to an approximate
position, then use the arrow keys to get the exact value you want.
For playback with “best quality,” clear the
Use jitter buffer check box. OmniPeek will
then play back the media as if there was an infinite jitter buffer.
All RTP packets will be played back at a regular interval, and
packets that arrive out of sequence will be re-ordered. To hear
what the media sounds like with a specific buffer size, select the
Use jitter buffer check box.



![Toni Kroos là ai? [ sự thật về tiểu sử đầy đủ Toni Kroos ]](https://evbn.org/wp-content/uploads/New-Project-6635-1671934592.jpg)


