
What is business value and how to measure it – LogRocket Blog
Learning how to build beautiful products without burning myself out (again). Writing about what I discovered along the way.
In recent years, business value has almost become a buzzword. Suddenly, everyone wants to focus on value and outcomes.
It is, of course, a great direction to head in. We finally got over the “working software is the primary measure of progress” principle of the Agile Manifesto and decided to focus primarily on value.
But, how do you define, let alone quantify, value? Value is such an intangible term that precisely measuring it is impossible.
There are, however, useful proxies for assessing value. We can categorize these proxies under two buckets: current value and unrealized value.
Mục Lục
Table of contents
Current value (CV)
Current value is the value that the product delivers today.
Current value is about measuring what type of value the product is delivering at the moment. The more valuable our products become, the:
- Higher the barrier to entry for competitors
- Higher the retention and the lower the churn
- More possibilities to monetize the product
We can measure value by understanding how satisfied customers and employees are and how effectively the business captures value.
Customer satisfaction
We’d all like to know how satisfied our customers really are, but it’s difficult to measure true satisfaction. Users themselves often have trouble defining exactly how satisfied they are.
However, there are a few proxies that help us paint a general picture of how good we are at satisfying customers:
- Net Promoter Score (NPS)
- Trustpilot rating
- Google/Apple Store ratings (for mobile apps)
- Core product metrics (engagement)
Employee satisfaction
Companies should deliver value not only to shareholders and customers but also to employees. There are numerous reasons to keep employees happy:
- Happier employees deliver better service to customers, leading to happier customers
- Higher satisfaction leads to higher retention; higher retention leads to lower recruitment costs and better knowledge retention
- It’s just the right thing to do
Some metrics that indicate employee satisfaction include:
- Employee Net Promoter Score (eNPS)
- All sorts of satisfaction surveys
- Rate of referrals
- Core engagement metrics (e.g., participation in company activities, etc.)
Revenue per employee
Let’s be honest — the promise of revenue is often one of the main reasons we create new products and businesses.
While measuring revenue itself is fine, revenue per employee is probably a more precise metric. It tells us not only how much we earn, but also how efficient we are at it.
A company that needs 20 employees to generate $1 million of revenue is more effective than one that requires 400 to deliver the same results (assuming we compare within one industry vertical).
The bigger the company, the higher the overhead of managing it. Recent layoffs prove the inefficiencies of blindly growing in size. Instead of blindly hiring new people, focus on optimizing the revenue that can be generated from people currently on board.
However, use employee satisfaction as a counter metric. Focusing on the revenue at the cost of employee satisfaction will backfire.
Unrealized value (UV)
Unrealized value is the potential future value the organization projects to attain if it meets all the needs of potential customers and users.
Unrealized value tells us how much is left on the table. It helps us determine whether there is room for further growth. Understanding this future potential helps us make decisions such as:
- Which product to invest in
- Whether we should maintain our strategy or pivot
- If our current target market is adequate to hit our business goals
Sometimes it’s better to invest in a product with low current value but high unrealized value than to invest in the most valuable product that has no new value to be captured.
We can assess unrealized value by measuring:
- Available market share
- Customer satisfaction gap
Available market share
The difference between your serviceable obtainable market and current market share tells you how attractive your current market is.
If your SOM is 10,000 businesses and you currently serve 2,000, then there’s a lot of unrealized value. After all, in the best-case scenario, you can grow a whopping 500 percent.
It’s a different story if you already serve 8,000 out of those 10,000 businesses. That remaining 20 percent of the market might not be worth the hassle. Perhaps it’s time to expand to more interesting markets?
Customer satisfaction gap
Growing market share is not the only way to grow the product. Another option is to deliver more value to the current user base (and, as a result, bill more).
You improve your value offering by closing the gap between customers’ desired experience and current experience.
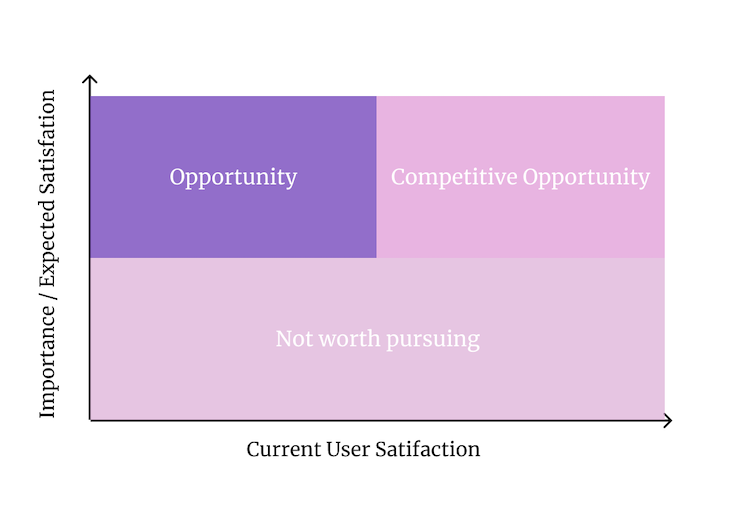
One of the ways to measure this gap is opportunity scoring. Ask your users to score:
- How satisfied/dissatisfied are they with key areas of the current offering?
- What’s their desired level of satisfaction? Or, how important is a particular area to them?
A factor with high importance (or expected satisfaction) and low-to-average current satisfaction creates a gap. We create value by closing such gaps.
Use business value to make informed decisions
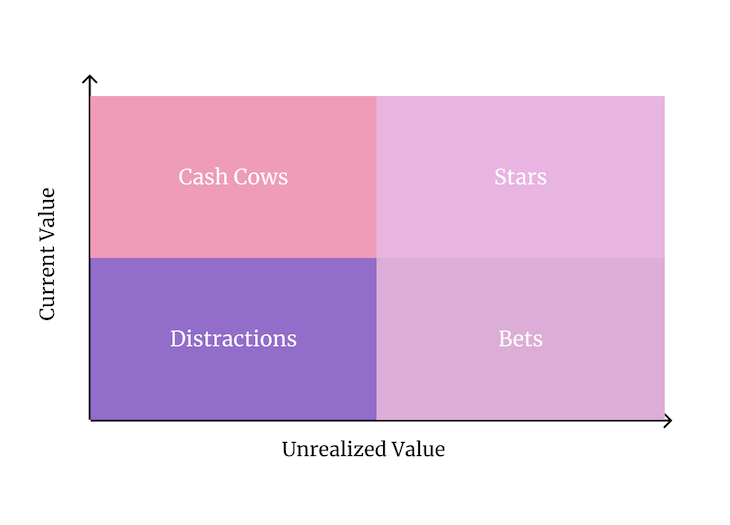
Once you estimate the current value and unrealized value, you can use a simple 2×2 chart to see where your priorities should lie. The matrix will help you distinguish between four types of products:
- Stars — These represent your core offering. You are already a major player here, and there’s still a lot of room for further growth. Keep your focus here
- Cash cows — Although there is a strong value offering here, there’s little room for growth. Focus on optimizing and defending the value for as long as possible, but don’t plan big swings here
- Bets — You don’t have an established value proposition yet, but there’s significant growth potential. The number of simultaneous bets should depend on your risk appetite, but as a rule of thumb, there should always be at least one in progress
- Distractions — Products with both low current value and low unrealized value are just distractions. Kill them
This matrix also works on a more granular level. Not sure which product features to focus on? Try to assess their CV and UV, and base your priorities on that.
When used correctly, the business value is a powerful metric. Use it to assess your current standing, estimate your future potential, and plan a path to bridge the gap between them.
Subscribe to our product management newsletter
Get articles like this to your inbox
Notice: JavaScript is required for this content.
Featured image source: IconScout


![Toni Kroos là ai? [ sự thật về tiểu sử đầy đủ Toni Kroos ]](https://evbn.org/wp-content/uploads/New-Project-6635-1671934592.jpg)


