
The role of social network analysis as a learning analytics tool in online problem based learning – BMC Medical Education
Mục Lục
Descriptive statistics
The course included 15 PBL groups; each group had a range of 6 to 12 students with one tutor. There were six discussion forums: five PBL discussion forums and a news forum (for course announcements, data of the news forum were excluded from the study. The course had 2620 interactions, mostly from students to students (89%), students to teacher interactions were 4.9% and teacher to student interactions were 6.15%. The range of interactions in each group was 48 to 332 (mean 216, SD 81.5). The picture was also similar on the course level; students dominated the interactions. Some groups were highly interactive such as groups 150, 144 and 149 and some were not such as groups 146, 140 and 141. A breakdown of each interaction type is presented in the course is presented in Table 1 for group level.
Table 1 Summary of interaction types in each group
Full size table
RQ1: what can SNA visual and mathematical analysis tell about PBL?
SNA can be used to map the relationships among actors, groups (visual analysis) and calculate the mathematical metrics of interactions and actors. The visual analysis was used to explore its role in shedding lights on the individual actors and their groups and how could this help learners or teachers. Furthermore, the mathematical analysis was used to quantify the interactions on the same levels, to demonstrate the utility of quantifications of interactions and how it compares to visual analysis.
Visual analysis
SNA visual analysis can be used on different levels, in our case three levels are relevant: the whole course level, the PBL group level and individuals’ level. Following is a demonstration of what each level can reveal visually.
On course level
One of SNA biggest advantages is the ability to sum up and map all interactions, as such it offers a bird-eye view of the relational dynamics in a course or a group. In the next Fig. 1, SNA rendered each PBL separately and identified each group, a property known as finding communities. This property is useful in finding the group of members who frequently interact with each other. The Figure shows each PBL group and the interactions among participants. Active groups can be recognized; an example is group A, B, and C; the three groups have dense interactions among participants. Groups D, E, and F, have a moderate level of activity; while G and H groups are less active with very few interactions among participants. Using such method may help pick the groups that need attention, a focused review or support.
Fig. 1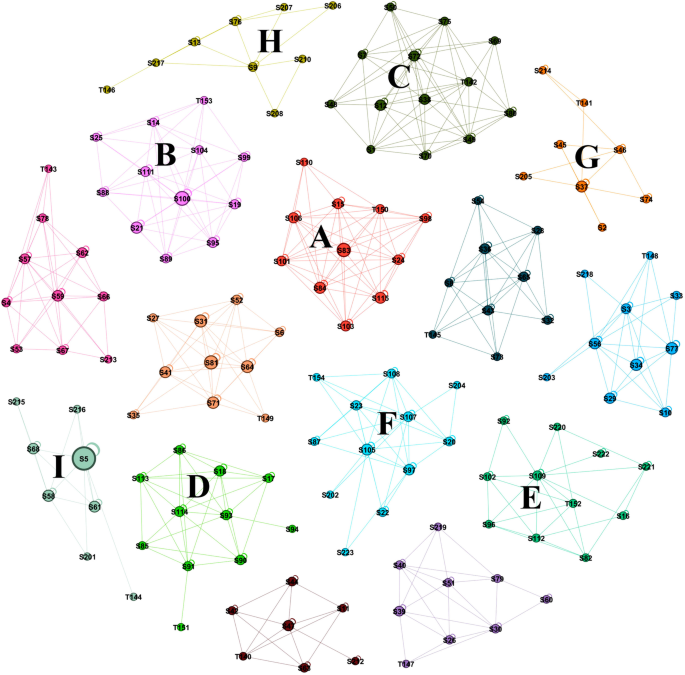
Interactions in all groups. Each circle represents an actor, each arrow represents an interaction, groups were coloured with unique colours to be easy to distinguish
Full size image
On group level
While the insights from the whole course network can be helpful to have a course overview, a focus on each group separately can demonstrate deeper information. In each group, the visual analysis using SNA can reveal the patterns of the interactions occurring in the group and how the students and the tutor perform; which are relevant factors for the evaluation of the PBL process. To demonstrate the potential of SNA and how much insight it can give, we present three Figures, in Fig. 2, group (A) is visually rendered in a sociogram. Regarding participants’ roles, it can be noted that student S83, S84, S15 are the most active students, while S110, S98 are the least active and are relatively isolated. The interactions are mostly occurring among students S15, S101, S84, S106 and the tutor. The role of the tutor who is coded as T150 can also be recognized, the node size indicates a moderate level of activity, and the arrows directions are indications that he received many interactions as well as communicated back with most students, the dark node color is an indication that his role was mostly moderating discussions among students. It is reasonable to say here that the information about the tutor was assuring that that tutor acted as expected from him. Regarding the group, the multiple interactions are an indication of an active group with diverse participation among most participants. To summarize, the picture SNA is rendered in Fig. 2, a picture of an active group with many active students, and few inactive students S110 who might need more attention from the tutor.
Fig. 2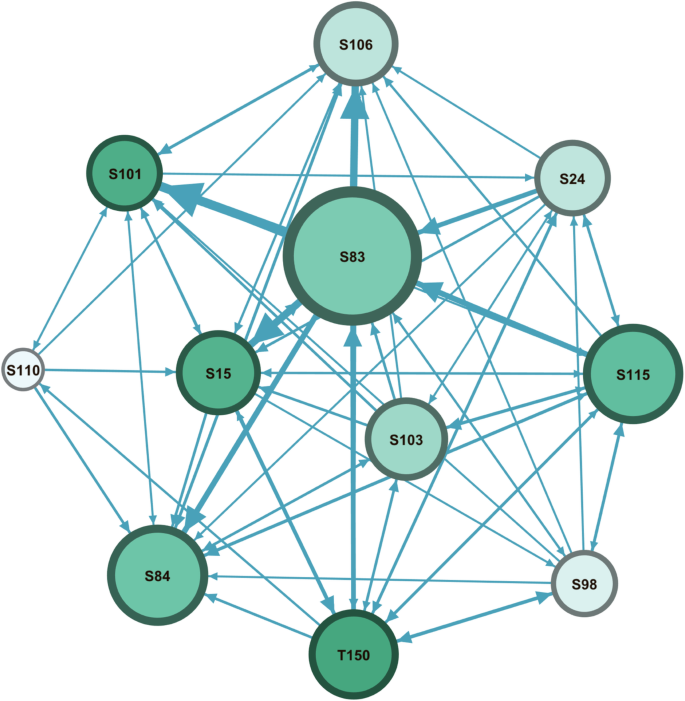
Interactions in group A. The node size was configured as degree centrality to reflect participants’ activity. The edges were configured so that the more frequent the interactions between two participants are, the thicker the line will be. The colour intensity reflects role in moderating interactions
Full size image
In contrast to the previous group, the next group (I) shows far lower level of activity. However, as shown in Fig. 3, student S5 is the most active participant, less so are students s58, S61 and S68, the remaining students are mostly inactive, the tutor role was very limited and made a single interaction with S5. Apparently, such group requires attention and the tutor might be contacted to play a more active role in the group, to stimulate students and promote interactions.
Fig. 3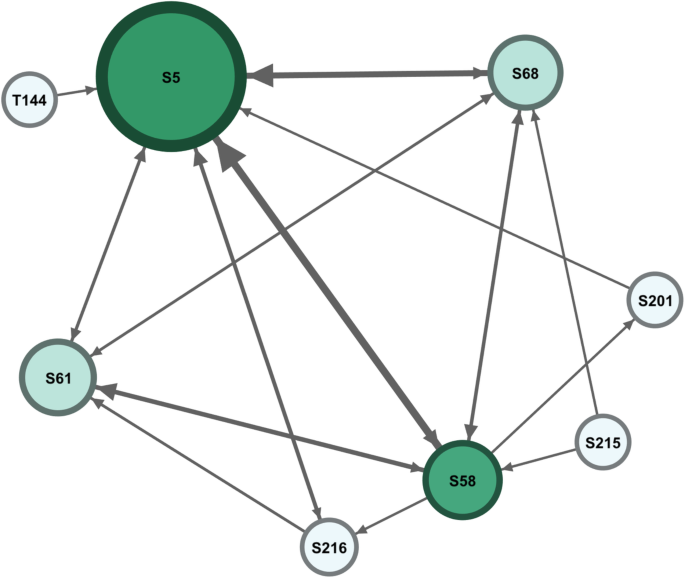
Interactions in group I. The node size was configured as degree centrality to reflect participants’ activity. The edges were configured so that the more frequent the interactions between two participants are, the thicker the line will be. The colour intensity reflects role in moderating interactions
Full size image
On individual level
On the individual level, SNA can highlight the network of individual users. For instance, we can have a student of interest that we would like to see his performance. For that situation, we can isolate his network in what is known as an ego network. To demonstrate this, we demonstrate the ego network of the tutor in another group, namely the ego network of the tutor of group I in Fig. 4. Although the group included 11 students, the tutor had only five students who communicated with him. A look at the full network in the side image, we can see that the students who needed help the most (the less active) were not helped, this is a clear example of an opportunity where an improvement can be made, by alerting the tutor to diversify his interactions and focus on the isolated students.
Fig. 4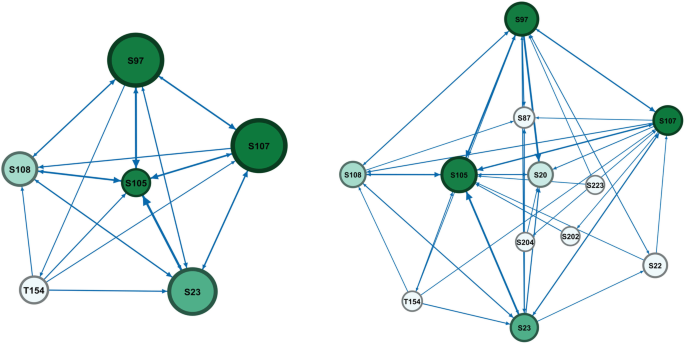
The tutor ego network compared to the whole network showing the tutor has interacted with a limited number of students. The node size was configured as degree centrality to reflect participants’ activity. The edges were configured so that the more frequent the interactions between two participants are, the thicker the line will be. The colour intensity reflects role in moderating interactions
Full size image
Mathematical analysis
On the course level
Mathematical analysis offers a quantification of interactions and roles which may enable accurate comparison of students and groups. It is also potentially useful as a measurement that can be used to forecast performance. The descriptive properties of participants in our study were as follows: the average outdegree centrality was 17.47, which means each participant has contributed with an average of 3.5 posts/week during the five weeks duration of the course, which is an indication of a relatively interactive course. The centrality measures of information exchange were also acceptable, the closeness centrality normalized score was 0.66, meaning that most students had moderate to high reachability. Same parameters can be obtained for the group and they are presentenced in the next section.
Further details are in Table 2.
Table 2 Descriptive statistics of participants
Full size table
On the group and individual level
As a demonstration, the mathematical parameters of a student are summarized in Fig. 5, compared to own group. The student, were actively contributing (outdegree 50) which is average 10 posts every week, received 27 replies (indegree 27), an average of 5.4 posts/week, an indication of the interest of peers to reply to the posts. Furthermore, closeness centrality is high which means he was close in the discussions to all other collaborators. However, betweenness 28.8 centrality is high, an indication that the student has connected and bridged interactions with others. The parameters of the group were also listed on the side to see how the student compared to others in the same group. The parameters were relatively high (high indegree, high outdegree, high closeness and betweenness centralities). One can reach the conclusion that that this was an active student in an active group.
Fig. 5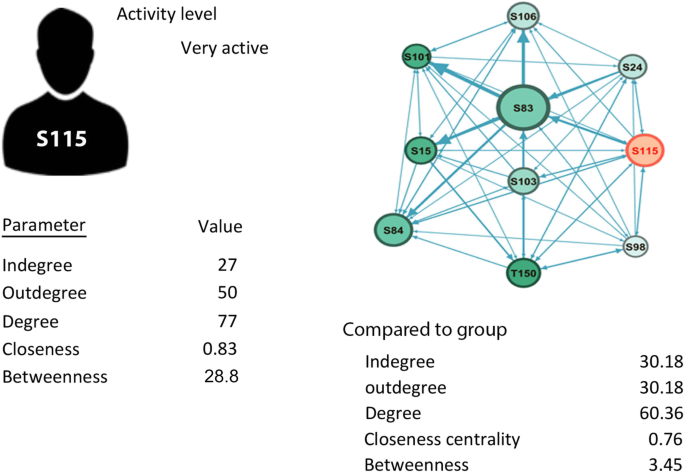
A social network profile model
Full size image
Social profile
To sum up a student or a user activity, we propose using SNA as a monitoring tool that displays the activity of a use (visual and mathematical) compared to own group for the teachers to use. The social network profile concept we propose can be applied in a learning management system dashboard to show social profile, connections and parameters. To demonstrate this, we chose a student from group A, showing ego network, the activity level and parameters for clarity, we also compare the activity to the group side by side. Comparison to his group will show if his activity level is proportional to colleagues or not and will highlight the other participants’ role. In case there is an unsatisfactory level of activity, one can understand the reason.
RQ2 do interaction parameters – as measured by SNA – correlate with better performance?
To see which of the SNA factors might correlate with better achievement, we categorized the parameters into three main groups: personal, group and tutor factors. The results indicated that outdegree centrality of a student, being in a group with higher average grade, communicating with the tutors, are the factors most correlated with better learning. The full details of correlation coefficient are displayed in Tables 3.
Table 3 Correlation between SNA parameters and achievement
Full size table


![Toni Kroos là ai? [ sự thật về tiểu sử đầy đủ Toni Kroos ]](https://evbn.org/wp-content/uploads/New-Project-6635-1671934592.jpg)


