
The Best Solution to Monitor your Home Network Traffic for Free (2019)
Our home networks are getting bigger every year. Almost every device these days require an internet connection. But while expanding your home network, how do you monitor everything? And even more, how do you find a problem in your network? Like which device is using all the bandwidth? In this article, I will help you install a free network monitoring tool and explain how you can monitor your home network traffic for free.
We are going to use a free version of PRTG for monitoring our network. This is one of the best network monitoring tools and the free version is perfect for home use. I am going to help you set up your network monitoring software step-by-step for your home network and explain how you can monitor your home network traffic.
When we are done you can see how much data each device has used on in any given period. If you have any question, just drop a comment below. If you liked this article I really appreciated it if you share it on your social network!
Installing PRTG Free for Home
To monitor our home network we are going to use PRTG. This monitoring tool is one of the most popular network monitoring software for enterprises, but it also has a free version. The free version has the same features as the paid plans but is limited to 100 sensors. To monitor your home network traffic, 100 sensors are more than enough.
We need to install the software on a computer that you keep running 24/7. This is necessary to get all the details from the network and alert you when something is wrong. The computer can be used normally while PRTG collects all the data. You only need to remember not to turn it off.

Step 1 – Install PRTG
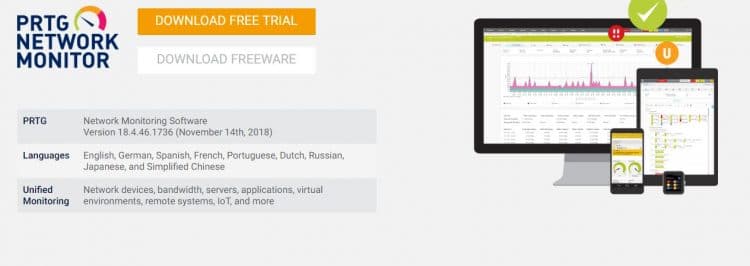
So we start with downloading PRTG Free from the PRTG website. Just click Download Free Trial or Freeware (both are the same) to get started. Install the software on the computer, this is pretty straightforward. Just run the installer and when it’s done it will open PRTG in your default browser.
Step 2 – Configuring PRTG
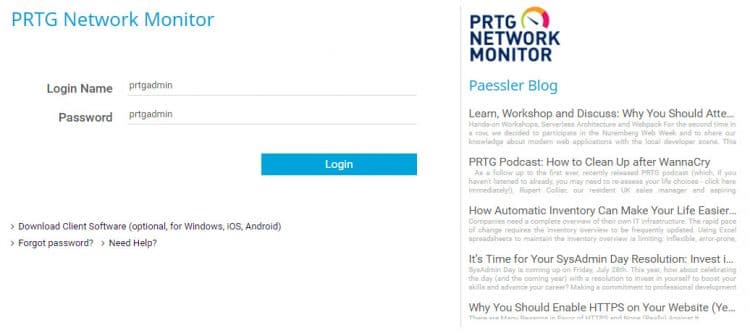
When the installation is done your default browser will open showing the login screen of PRTG. The default username and password are prtgadmin. You can always open PRTG by navigating to http://localhost on the computer where you install it.

Change the default PRTG Port (optional)
By default, PRTG will run on port 80 for HTTP and port 433 for HTTPS. Keep in mind that this can conflict with other software that is running on your pc. You can change the port number in the PRTG Administration Tool:
- Go to Start
- Find the PRTG Administration Tool
- Go to the Web Server tab
- Select Expert Configuration
- Use SSL
- And set a port number (here I used port 6100)
After you saved the settings you can open PRTG by navigating to https://127.0.0.1:6100 or to https://<your-computername>:6100
Change the default password
One of the first things we want to do is change the password:
- Goto Setup
- Select MyAccount
- Change your password under the User Account tab (select Specify new password)
Setting default device credentials (optional)
For most of you, this isn’t relevant in a home network environment. Only if you have a lot of network device or running a Windows Domain you could save some time by setting the credentials on a top-level group.
If you want to set the default credentials, then go back to the Devices tab. Here you will see a list of all the discovered devices. PRTG will automatically start with an auto discover to scan your local network for devices. We will get to that later on.

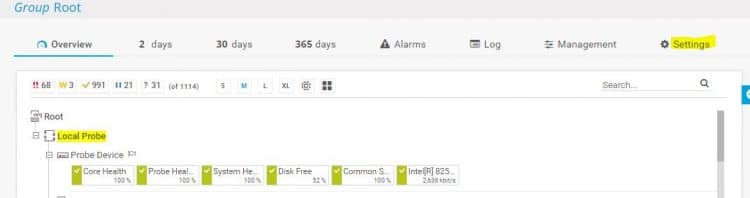
For now, we select the Local Probe and click on Settings. We are going to set some default credentials for our network. This is only useful if you have multiple devices on SNMP v3 with the same credentials or running a Windows Domain at home.
If you scroll down the Probe Settings page you will see Credential options for different protocols. They are all set on “Inherit from root”, turn it off to change the credentials.

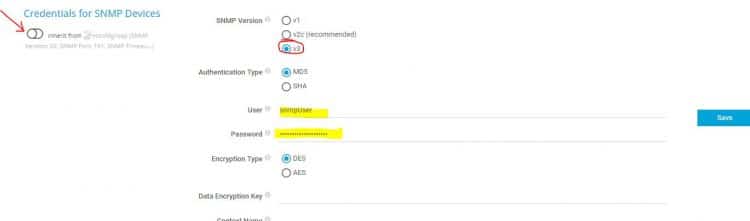
You can do this for all the relevant protocols and for you Windows Systems if they are all part of a domain.
Step 3 – Clean up
Before we start adding devices to PRTG we are first going to clean up the device list. By default, PRTG will start with the Smart Setup. It runs an autodiscovery over your local network and creating some default groups Now, this can be useful, you don’t have to add all the devices by your self. But the problem is you don’t have a good structure to start with and a lot of empty groups.

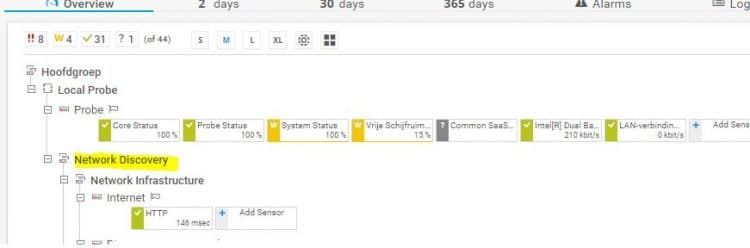
To remove all the devices, right click on the Network Discovery group and click on delete.
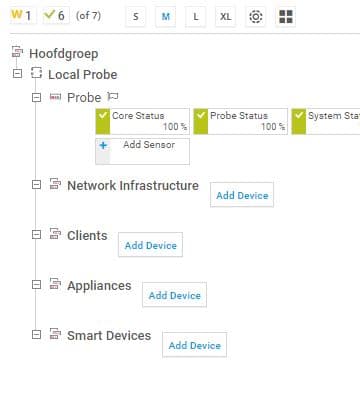
Step 4 – Create a new Structure
To monitor a home network we don’t need a really big structure. We can divide our network into a few groups:
- Infrastructure
- Clients (mainly computers)
- Appliances (Tv, Printer, Solar Power Converters)
- Smart Devices.
Right click on the Local Probe to add a New Group under it. After you created the groups your Device Tree will look like this:
Adding all devices
We are now ready to start monitoring our network devices. To easiest way is to create a new Auto-discovery Group named “Temp”. You will need to know your local IP range to create this group. If you don’t know it, you can find it by going to
- Start
- Type
CMD
and press enter
- Type the following command:
ipconfig
The result will look similar to this:
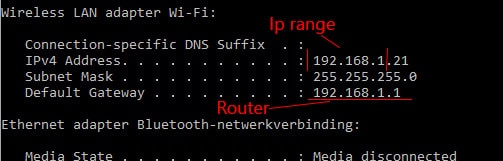
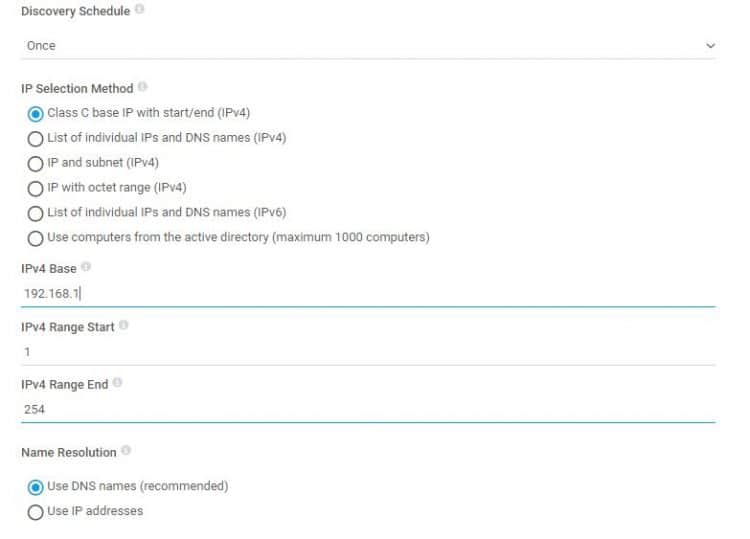
So the Ip Range is 192.168.1 and the IP address of the router is 192.168.1.1 (we need that later). Now create the temporary Auto-discovery Group. Set the Group Name to Temp, and scroll down to IPv4 Base. Here you enter the IP Range of your local network, in my case: 192.168.1. Leave everything else on default and click OK

This will take a couple of minutes, a good time to get a coffee before we continue.
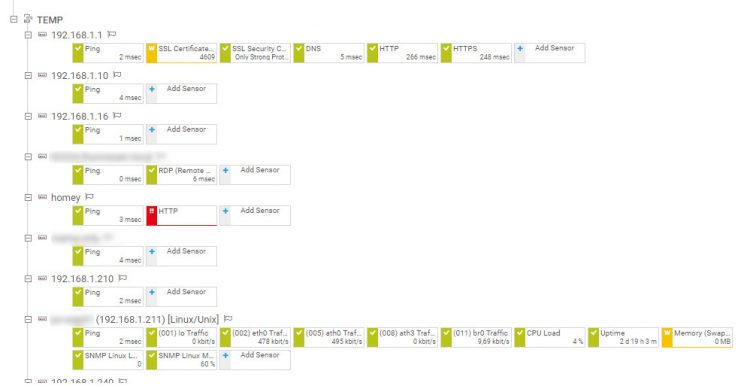
After a minute of 5 PRTG has scanned every device that it could find in your network. Now it’s time to move the devices to their groups. You will recognize some of the devices by its name, but other might show only an IP Address. Start with the devices you know, then we can work on the devices that are left.
To move a device in PRTG to another group, just right click on the device and select Move > To Other Group. While you are moving the device to their groups, it is a good idea to rename the devices so you can recognize them a little bit easier later on. Just click on the device name and go to the settings tab. Change the device name (and icon if you want to)

Resolving unknow devices
After we moved the known devices to their corresponding groups (like computers or homey (a Smart Hub) ) we are left with some IP Address. Earlier we looked up our IP Range, in the output we also noted the Gateway address, this is our router. In my case it was 192.168.1.1, so we can move the device with that address to the Network Infrastructure group.
To help find the other devices, you can use a free program called Advanced IP Scanner. Install the program and click in the Green Play button Scan to start the network scan. This will return a list with all active network devices.

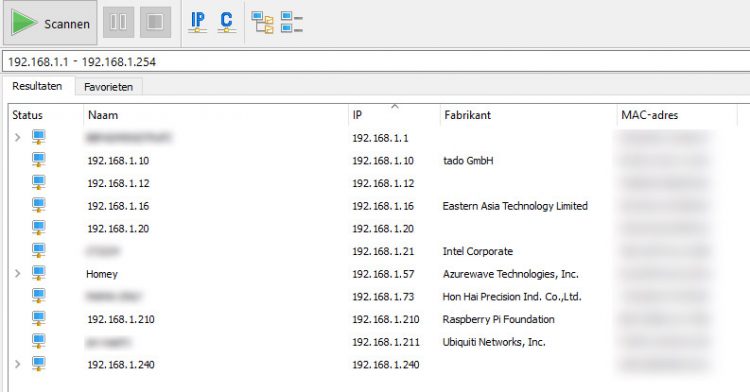
The advantage is of this tool is that it will also show the manufacturer. This way we now know that the device with 192.168.1.10 is my Smart Thermostat Tado and the device 192.168.1.211 is the access point. But after this tool we are still left with some unknown devices, these can be your smartphones (login to your router might show the connected wifi clients) or smart tv’s (check the network settings on your tv to find its IP Address)
What you also can try is to navigate in your browser to the IP address, some network devices can be managed over the web (like your router or switch). Work your way through the list sorting out every device in your network. Also remember to turn on all network related devices when you run the scan (game consoles, tv’s, notebooks/tablets).
Scanning the devices
Because we used the auto-discovery group, PRTG has already found some of the available sensors. But if you want the details from a computer, like for monitoring the used bandwidth, we need to enter the credentials of the device.
Select the device and go to the settings tab. Scroll down to Credentials for Windows systems (or Mac) and fill in the details. Just enter the computer name and the login from an admin account. This will allow PRTG to scan the device. When you are done, click on Save. Right click on the Device name in the top left corner and select Auto-Discovery > Run Auto-Discovery. PRTG will scan the device again with the new credentials.

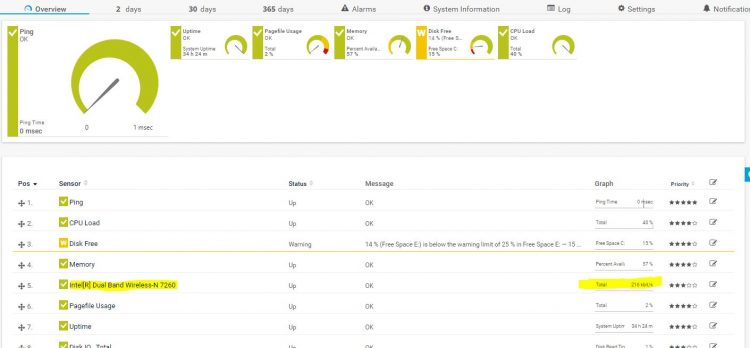
After it’s done you will a lot more sensors of the computer. In the list you will find the network card, you can recognize it by its name (Intel …. Wireless.. ) and on the right side, it says Total *** Kbit/ s. You might have another network card, but you can still find yours by looking at the Graph column and search for the sensor with Kbit/s.
Creating a Network Map with PRTG
We now have all the sensors for our home network, so we can start with creating a network map. The network map will help you identify problems and monitor your network traffic within your network.
Click on Maps in the top navigation bar and Add Map (blue label on the right side). Set the map width on 1700 and height on 750. This allows you to view the full map on a Full HD screen without scrolling.
On the left side you will the devices we added to PRTG in the structure we created. On the right side, you find all sort of icons. Adding a device to the map is pretty simple, select the sensor, device or group on the left side. It will highlight blue, then find an icon, graph or table on the right side and drag it on the map. You can always change an icon by dragging a new icon over it.

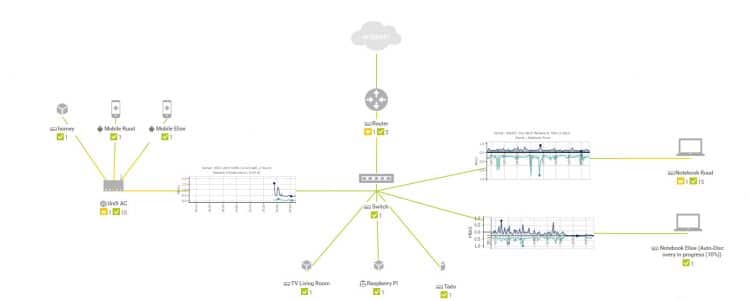
I used Default Icons A on the map above for all the devices. The internet cloud can be found in Default Icons B (these are icons without sensors). The graphs are 2 days (small fonts) graphs. You can connect the device by dragging the blue line to another icon.
Cleaning up sensors
If you want to use graphs as I did in a network map, then you might want to clean up the network sensors. On my notebook, for example, I had more than 15 channels on the network card sensor. All were displayed in the graph, making it harder to read. We only need the traffic in and traffic out channels. To clean the graph up, you click on the network card sensor > click on the gear icon behind a channel and select Hide from Graphs. Do this for all channels, except the traffic in and out channels.
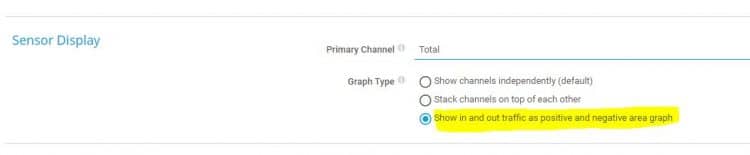
Show In and Out traffic as positive and negative
Normal PRTG graphs will stack the lines of the in and out traffic, making it harder to read. What you can do is change this behaviour to show the outgoing traffic as a negative area in the graph. Go to the settings of the network card and scroll down to Sensor Display. Change the Graph Type to “Show in and out traffic as positive and negative area graph”.

How to Check Bandwidth Usage per Computer
If you have PRTG running you can use it to check the bandwidth usage per computer. Because we are monitoring every device, we have a good overview of who is using the most bandwidth on our network. There are some limitations with PRTG, you can read how much bandwidth your access point is using, but each individual wifi device (mobile) is a bit harder. You could install PRTG Mobile Probe on each mobile device, but an easier solution is to use a Unifi Access point.

So let’s say you want to know how much bandwidth a computer has used the last weekend. We need to get the historical data from the computer to examine how much bandwidth is used. You can do this as follows:
- Select the device in the device list
- Select the network sensor
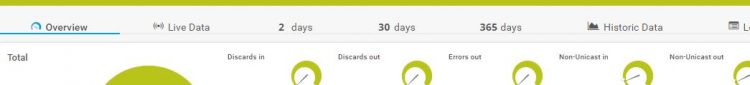
- Click on the Historic Data tab
- Set the date range (or use a Quick Range)
- Click on Start
A new page will open with the results. Below the chart you will see a table, we are looking for the Sums of the Traffic Out and Traffic In (and maybe the Traffic Total)

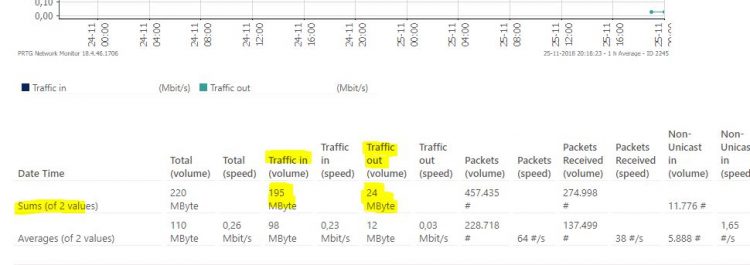
I did a clean install of PRTG to write this guide, so I haven’t used a lot of data yet. But you can see here the amount of data I used. By default the results will be in Kbit/s, you can change this by going to the settings of the network card sensor. Scroll all the way down and change the Channel Unit Configuration to MByte and Mbit. This will make it easier to read.
Monitoring Network Traffic
An important part of monitoring is set up alerts. You don’t want to look every hour on your network map to see if everything is working. PRTG will send you an alert when a device is down, but you also need to set some limits. Like, alert me when Computer X has used 50Gb of data.
Configure Notification Delivery
Before we can send notification we first need to configure the mail service in PRTG. In default, it will use its own built-in mailing system, but that doesn’t work well in a local network. So we are going to use an SMTP server this. I am going to use the SMTP server from Gmail, but you can also use the one of your provider for this.
To configure Notification Delivery, you need to go to Setup > System Administration > Notification Delivery. Fill in the following details:

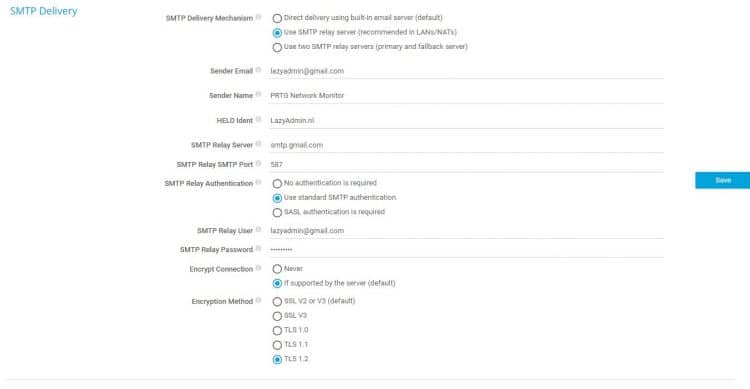
Delivery Mechanism: Use SMTP Relay Server
Sender Email: your email address
Helo Ident: something.tld (doesn’t matter)
SMTP Relay Server: smtp.gmail.com
SMTP Relay Port: 587
SMTP Relay Authentication: Use standard SMTP Authentication
SMTP Relay User: your Gmail address
SMTP Relay Password: your Gmail password
Encryption Methode: TLS 1.2
To use Gmail, you will need to change a setting in your Google Account to allow other apps to send mail. The setting is Allow less secure apps that you can find under https://myaccount.google.com/lesssecureapps.
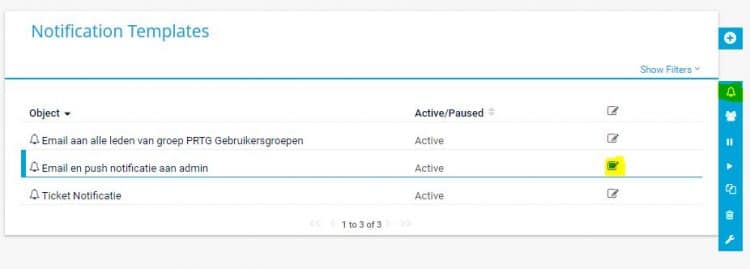
To test the notification you need to go to Setup > My Account. Then select the tab Notification Templates. Click on the edit icon and then click on the bell icon to test the notification:

Creating Notifications
You can create al kinds notifications, but we want to monitor our network traffic. So we are going to set an alert when a computer is using more than 50Gb of data within a month.
- Select the network card sensor of a computer
- Click on Notification Triggers
- Click on the Blue Plus symbol on the right side and select Add Volume Trigger
Create a rule with the following conditions:
when Total channel has reached 50 Gbyte per Month perform Email and Push Notification to admins


You can create more rule like this, for example, to send a warning when a computer has reach 40Gbyte of data.
Conclusion
With PRTG you can really easy monitor your home network. It will not only show you the amount of bandwidth a device has used, but also the amount of space left on the hard drives, if devices are up or any other problem within your network.
Pin
2
Share
15
Shares


![Toni Kroos là ai? [ sự thật về tiểu sử đầy đủ Toni Kroos ]](https://evbn.org/wp-content/uploads/New-Project-6635-1671934592.jpg)


