
PRTG Network Monitor Review 2023 – Step-by-Step Install & Setup
PRTG (Paessler) is one of the most well known names in Network Monitoring and rightfully so – alongside Solarwinds, ManageEngine, and IpSwitch, they dominate a large share of the IT Infrastructure monitoring space.
Today we are going to Review PRTG Network Monitor and see how it can be used to monitor Cisco devices and Windows servers. We suggest you download a PRTG Free (which is good to monitor up to 100 sensors for Life) and follow along as we setup, Configure and Review PRTG and its features.
Note about Lab Environments: When Setting up a Lab Environment for this PRTG review, You may need to
When Setting up a Lab Environment for this PRTG review, You may need to Generate some Network Traffic with any of these Tools to start Seeing Stats in your Dashboard
Network Monitoring is a very important aspect of network management for several reasons. For example, a network administrator can troubleshoot and resolve issues on a network by going through and analyzing event logs generated from monitored devices. Also, network monitoring can help with detecting intrusions on a network such as the one caused by a worm that consumes most of the network bandwidth.
Even though network monitoring can be done manually, it is usually easier and more effective to use tools that have been specifically created for such purposes. PRTG Network Monitor is one of such tools. It provides a lot of features like automatic network discovery, availability, health and performance monitoring, alerting and notifications, reports and so on.
Mục Lục
Let’s Review PRTG Features, Pricing, and Compatibility
PRTG Network Monitor is available for a 30-day Free trial (unlimited sensors) and after the 30 days, can be used forever with a Limit of 100 sensors. Pricing is broken down below:
License Type
# of Sensors
Price
Freeware Edition
100
FREE Forever
30 Day Trial
Unlimited (30 Days)
FREE (30 days)
PRTG 500
500
$1,600
PRTG 1000
1000
$2,850
PRTG 2500
2500
$6,150
PRTG 5000
5000
$10,500
PRTG XL1/Unlimited 1
Unlimited
$16,900
PRTG XL5/Unlimited 2
Unlimited
$60,000
1. License allows 1 Single Core Server Install w/o Software Defined Limits for the number of Sensors, probes or Users
2. License allows 5 Core Server Installs Worldwide w/o Software Defined Limits for the number of Sensors, probes or Users
With its competitive pricing model considering their extensive feature list and options they provide. This PRTG Review was more to showcase its ease of use in an actual network and server environment, as you can see below, but we’ll highlight its main features below:
- Auto Discovery of Network Devices and Servers
- Robust Alerting and Notification System (see below for configuration details)
- Mobile Apps for iOS (iphone and ipad devices) and Android Phones/Tablets
- Real-time Maps to Visualize Congestion and other pain points.
- Create Custom Networks Maps and Visuals
- and much more.
PRTG system requirements call for 2 Cpu Cores for 1000 Sensors and up to 8 CPU Cores & 16GB of RAm for 5000-10,000 Sensors. PRTG can run on all Windows Version (including Windows 7, 8, 10, 2008 Server, 2012 Server and 2016 Server).
The interface is accessed through a Web-browser with a screen resolution of at leaste 1024×768.
Lab Setup
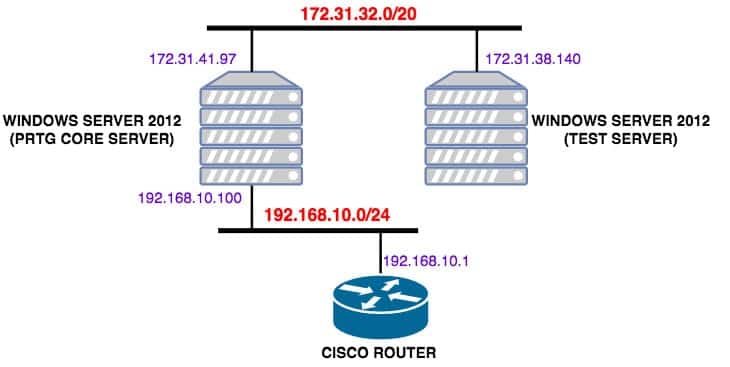
Now, lets install the 30-day free trial of PRTG Network Monitor on a server and use it to monitor a test environment made up of 2 Windows Servers and one Cisco Router.
Note: We will be installing PRTG Network Monitor on one of the Windows Servers.
For this lab, we are using virtual instances on Amazon Web Services (AWS) as my Windows servers. My Cisco router is running in GNS3 installed on one of the servers. The GNS3 setup is as shown below:

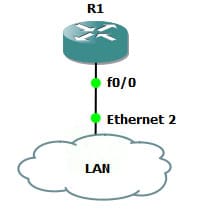
To connect the GNS3 router to the real network of the Windows Server, I created a loopback interface (Ethernet 2) on the Windows Server, assigned it an IP address (192.168.8.100) and then connected my router interface (Fa0/0) to a cloud in GNS3 representing that loopback interface.
Hint: Creating a loopback interface in Windows 8 upwards is very easy. Just search for Loopback Manager and follow the steps shown in the command window.
I have a very simple configuration (IP address and SNMP read-only community string) on the router as follows:
interface FastEthernet0/0

ip address 192.168.10.1 255.255.255.0

no shutdown

!

snmp-server community snmp123 RO
With my lab setup, I will make sure there is connectivity between the PRTG core server (the Windows server on which PRTG will be installed) and the other devices:

Awesome!
Getting Started
Let’s now get into the core of this article. In this section, we will cover the preparation steps for using PRTG Network Monitor, its installation, using the smart setup, adding devices, adding sensors, adding auto-discovery groups, and finally, notifications.
Preparing to use Paessler
There are two types of PRTG Network Monitor: PRTG on premises or PRTG in the cloud. In this article, we will be reviewing and dealing with PRTG on premises which is the one you download and install on your server.
Note: Even though my Windows Server is technically in the AWS cloud, this is not a PRTG in the cloud installation. In PRTG in the cloud, PRTG is delivered as a cloud service to customers – no installation necessary; just activation of an instance.
PRTG can be installed on most Windows Operating Systems as we detailed above, however the recommended OS is Windows Server 2012 R2, with at least Dual core CPU and minimum of 2GB of RAM.
Note: PRTG also recommends installing on a physical machine instead of a virtual machine.
One of the primary ways PRTG is managed is through a web interface. PRTG supports Google Chrome 59+ (recommended), Mozilla Firefox 54+ and Internet Explorer 11+. In my lab core server, I have Google Chrome installed.
Hint: PRTG can also be managed using the Enterprise Console which is a native Windows application.
To get started, we need to download the PRTG installation file to the computer we will like to use as the PRTG core server.
Since we will be using the trial license, we will Download the Installation File here.
![]()
![]()
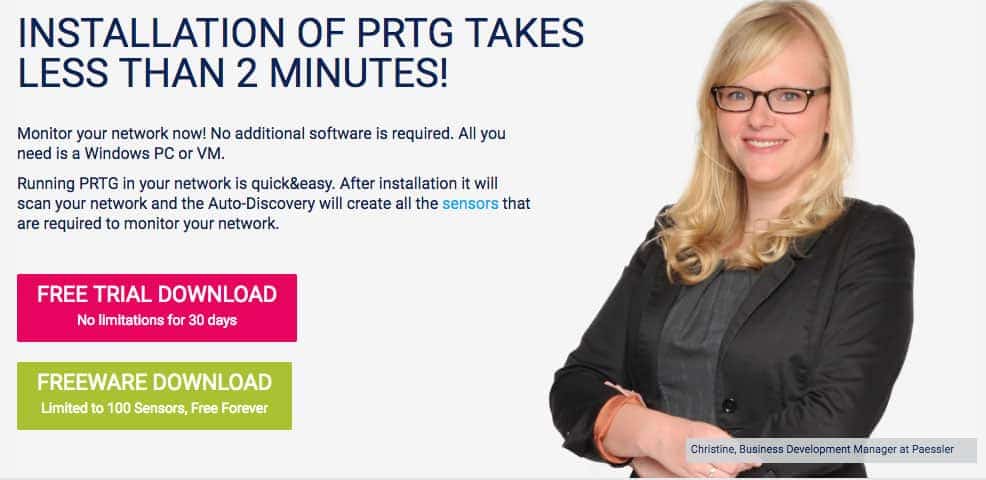
Click on either “FREE TRIAL DOWNLOAD” or “FREEWARE DOWNLOAD” – they go to the same link.

Please take note of the generated license key (e.g. copy into a notepad file) as we will need it at a later step.
Hint: If you lose the license key for whatever reason, just go back and generate another key by following the steps to download again.
The next step in the preparation phase is to determine what will be monitored. Even though you can potentially monitor all the devices on your network, ideally, you want to start with your critical infrastructure such as Internet edge router/firewall, core switches, important application servers and so on.
Once you have decided on what to monitor, you should determine what will be monitored on those devices. For example, you may be interested in monitoring bandwidth utilization on your edge device. You may also be interested in monitoring the disk space on your file servers. One of the cool things about PRTG is that it can recommend which sensors to activate for various devices.
Hint: A sensor is used to monitor a particular value e.g. availability (ping), CPU load, etc.
Finally, we need to determine which technology/protocol will be used to monitor our devices and prepare accordingly. PRTG supports monitoring via several protocols including Simple Network Management Protocol (SNMP), Internet Control Message Protocol (ICMP), Secure Shell (SSH), Windows Management Instrumentation (WMI), NetFlow and so on.
Related Post: Best SSH Clients For Windows
Since we will be monitoring Windows Servers and Cisco devices, we will rely on SNMP (for both Windows and Cisco) and WMI (for Windows only). PRTG recommends using mostly SNMP because it generally has a better performance. To use WMI, all we need is to specify the (administrative) login credentials of the servers.
Hint: If your network uses Active Directory (AD), it may be easier to monitor using WMI since you will only need to specify one login user/password. For standalone deployments, you will need to specify unique computer names, users and passwords.
We have already enabled SNMP on the Cisco router (refer to the configuration above). We are using SNMPv2c with a community string of “snmp123”.
Since it is easier to monitor using SNMP, we can also enable SNMP on our Windows Test Server.
Note: We don’t need to do anything on the Windows Server on which PRTG will be installed because PRTG installs a local probe on this system with which it uses to monitor the server on your LAN.
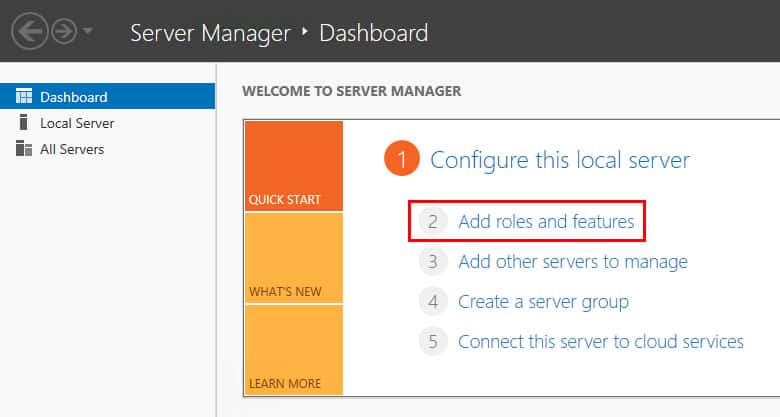
You can follow the steps here to enable SNMP on different operating systems which is used primarily for polling and Monitoring Operating Systems and networked devices. I will show the steps for Windows Server 2012 here since we need to do it for the Test Server. First open Server Manager and click on Add Roles and Features:
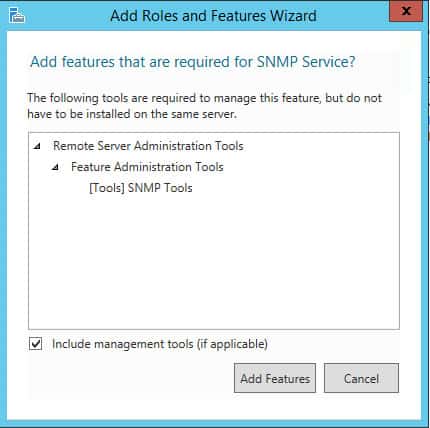
Press Next until you get to Features and scroll down to SNMP Service:

Check the SNMP Service box and then click Add Features.
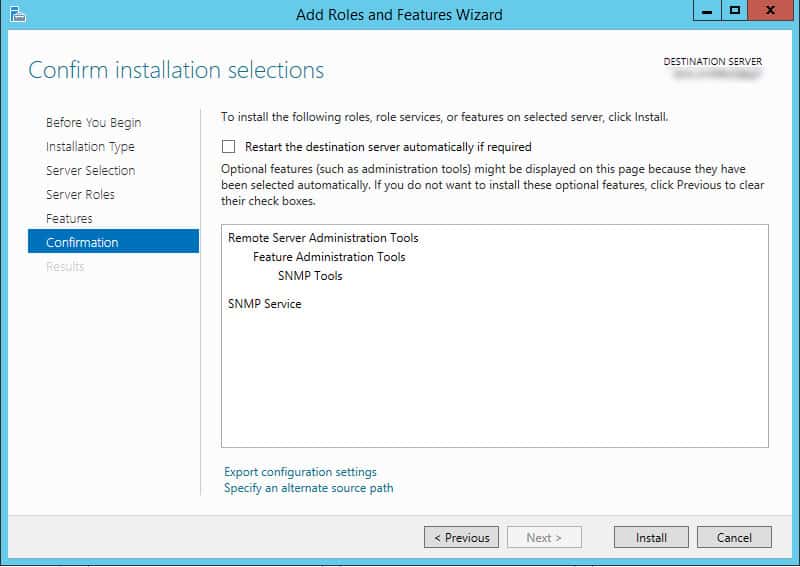
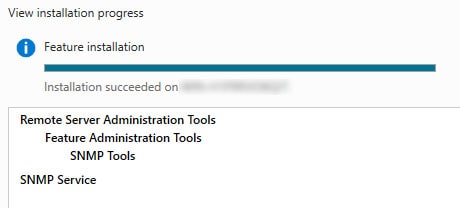
Click on Install to complete the installation.
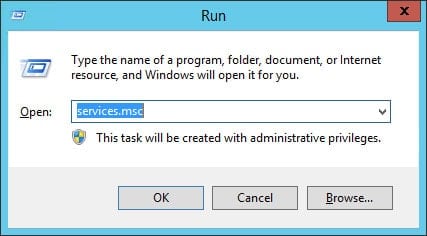
Now that the SNMP Service has been installed, we need to configure some things i.e. community string and allowed hosts. Open the Run dialog (Windows+R), type services.msc and press OK.
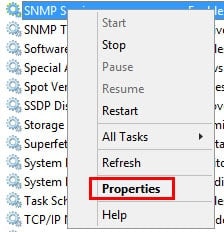
Scroll down to the SNMP Service, right-click and select Properties:

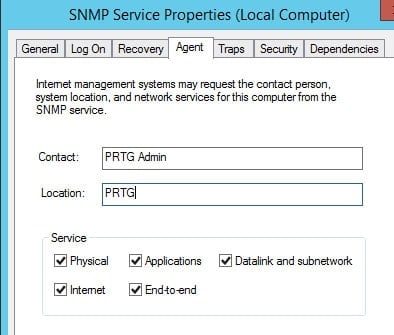
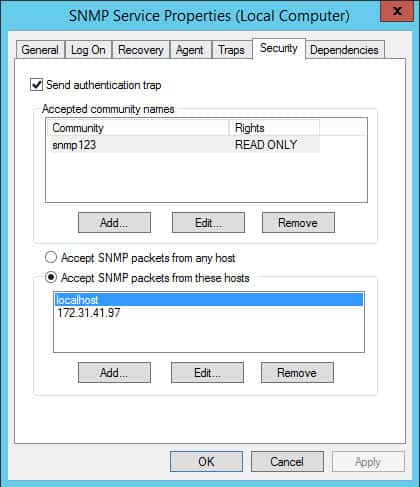
Enable all the fields under the Agent Tab:
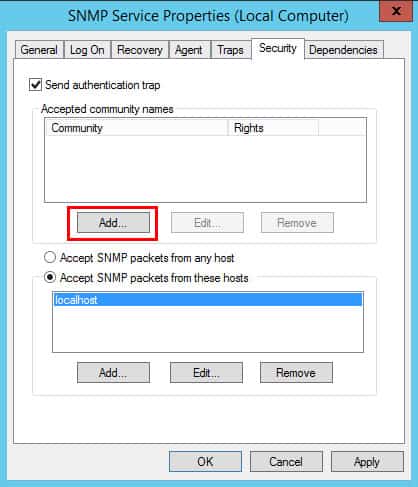
Go to the Security tab and click on Add to add a community string.
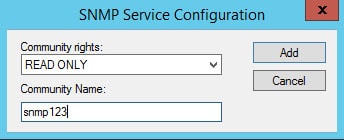
Add a community string of “snmp123” as READ ONLY and press Add:
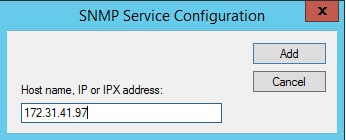
Now, let’s add a host that will be allowed to query this Windows Server. This will be the IP address or DNS name of the computer running PRTG.
Note: Even though you can allow any host to query your computer using SNMP, this is not secure or recommended.
Click on (the lower) Add and add the IP address of the host running PRTG. In my case, the IP address is 172.31.41.97.
This brings us to the end of our preparation steps.
Installing PRTG
We can now go ahead with the installation of PRTG. Navigate to where the installation file was downloaded and unzip it.
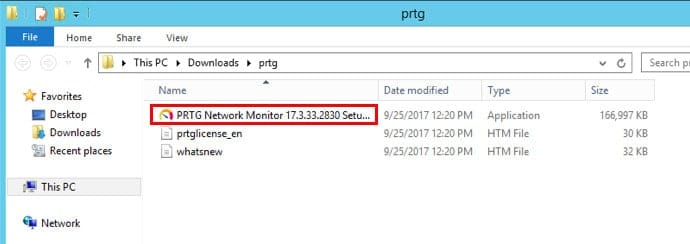
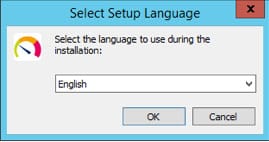
Click on the setup file and select your language:

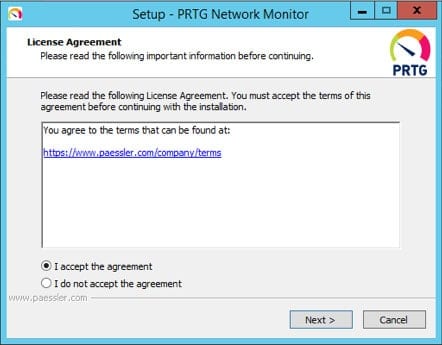
Accept the license agreement:
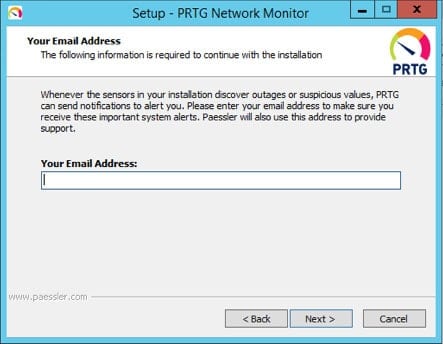
Enter a valid email address to be used by PRTG to send your email notifications (e.g. interface down). This email address will also be used to provide support by the PRTG guys (Paessler) if necessary.
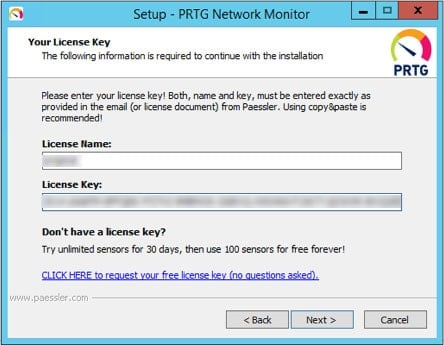
Enter the license name and key you were given when you downloaded or purchased PRTG:
When the installation is complete, PRTG will automatically open a web interface at http://127.0.0.1.
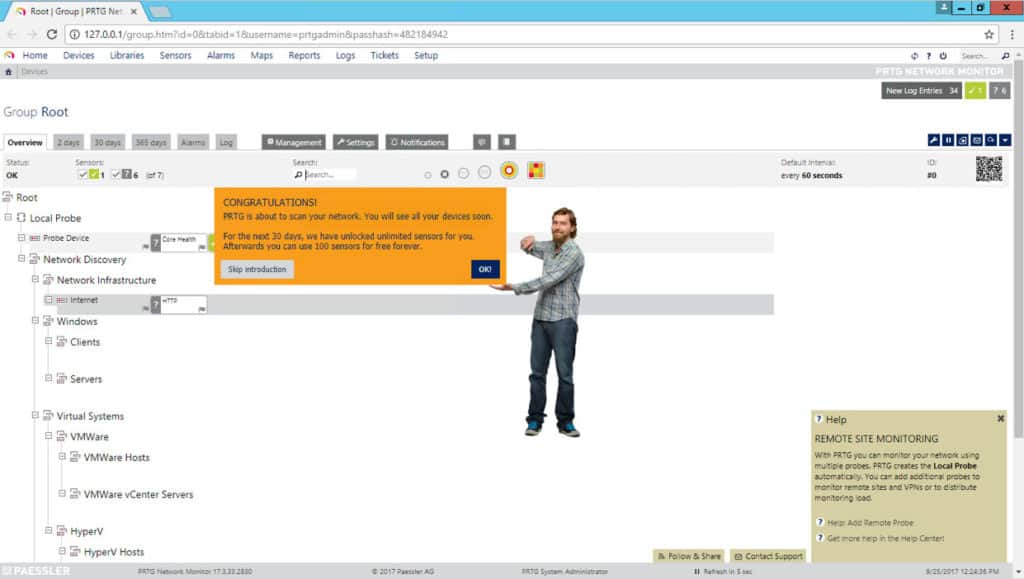
On this page, you will notice that PRTG has already created a Device Tree which shows different devices (at least the Probe device) and sensors organized into groups. This tree was automatically created using the Auto-Discovery function of PRTG. At the minimum, auto-discovery will search for available devices using ping.
You will also notice one of the Paessler employees to the left of the screen. This is PRTG’s Smart Setup feature which takes you on a tour of the PRTG web interface and prompts you to set up your monitoring information such as SNMP credentials, web admin password and so on. You can skip the Smart Setup if you are already familiar with PRTG but if this is your first time using PRTG, it is recommended that you follow the guide in the Smart Setup to get you up and running.
Smart Setup
Since this is a beginner article, we will follow the steps from the Smart Setup; therefore click on OK.

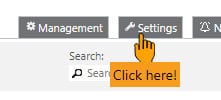
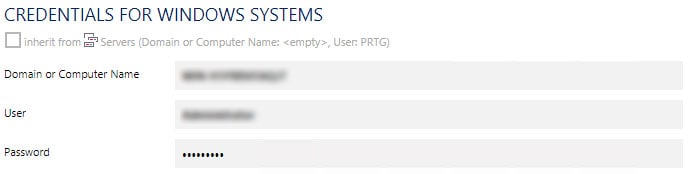
The first thing it will ask us to do is configure some settings like monitoring credentials. Click on Settings at the top center of the page.

In our case, we are only concerned with the “CREDENTIALS FOR WINDOWS SYSTEMS” and “CREDENTIALS FOR SNMP DEVICES” sections.
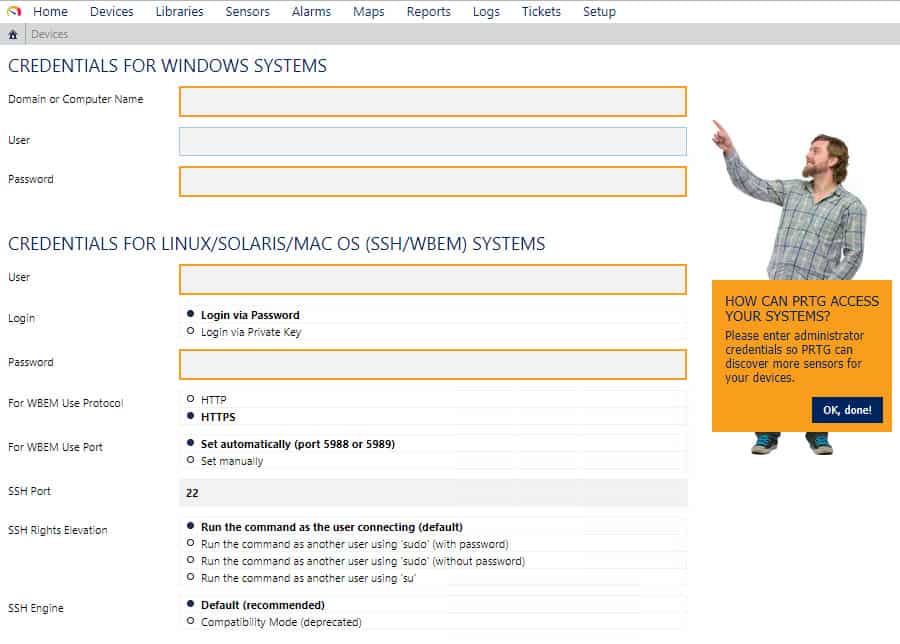
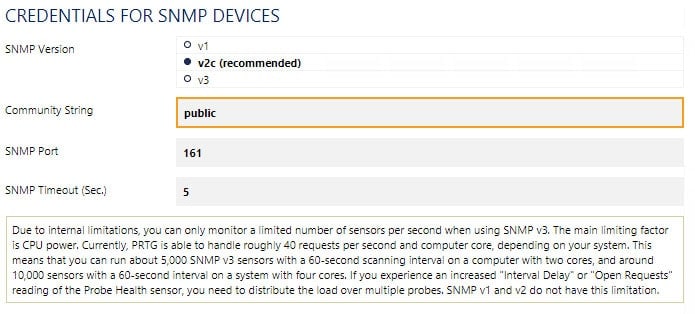
Enter the appropriate credentials and click on “OK, done!” to save the credentials.
Next click on “OK, do it!” to allow PRTG run Auto-Discovery again. Since it now has the appropriate credentials, it should be able to get more information about the devices on the network.

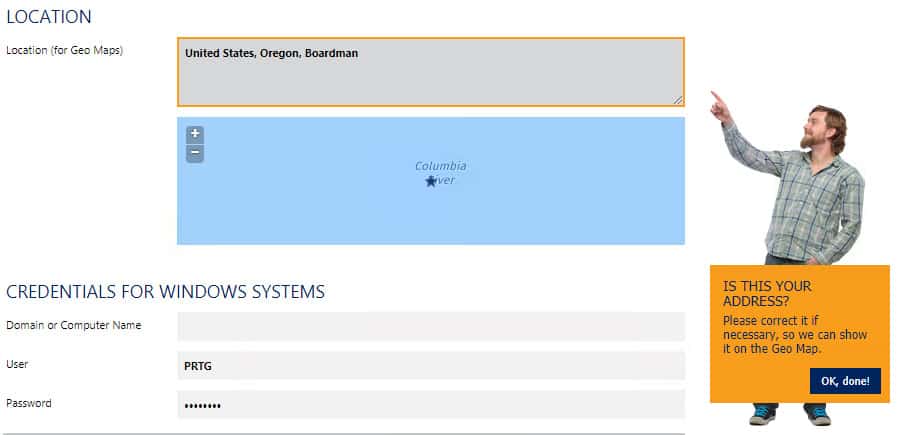
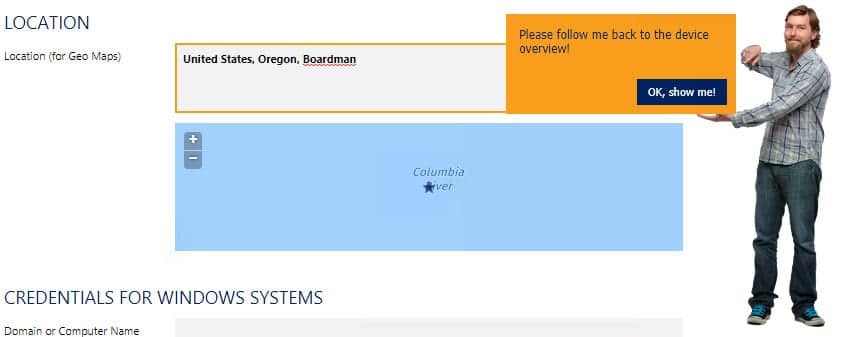
Next, we have to enter our location so that it can be shown on a map (if we will use this feature). This can be very useful if you are monitoring networks in different geographical locations.
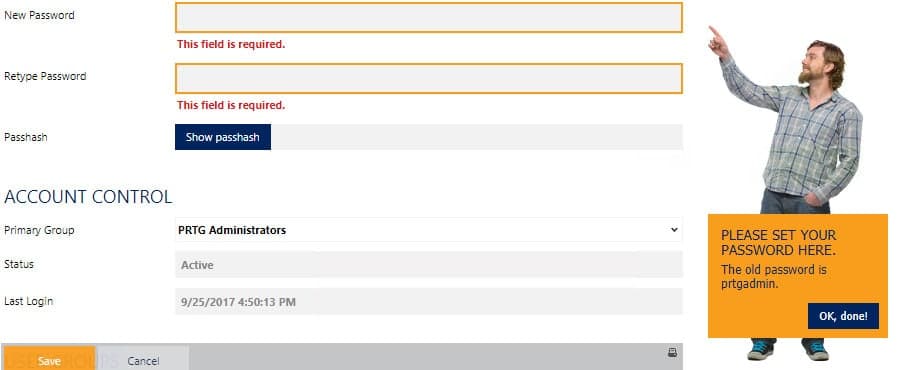
The next thing to do is to change the default password used to access the PRTG admin interface.


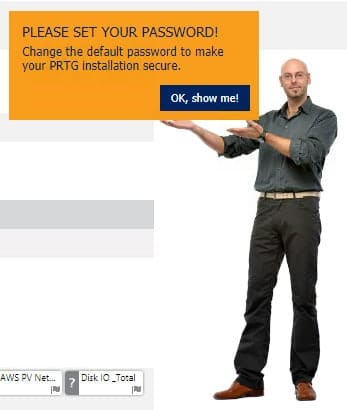
By default, the username is prtgadmin and the password is also prtgadmin. You can change it to anything you want.
At this point, we can also edit the email address that will be used for notification purposes.
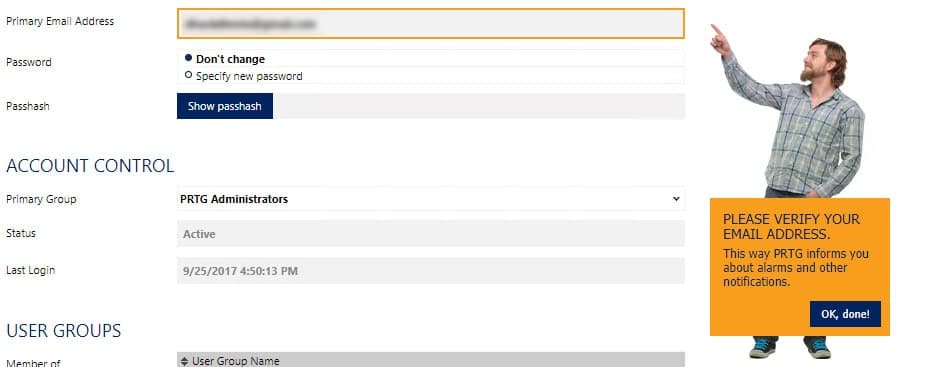
Setting the email address is the last step of the Smart Setup and then you are directed back to the Device Overview page.

Adding a Device
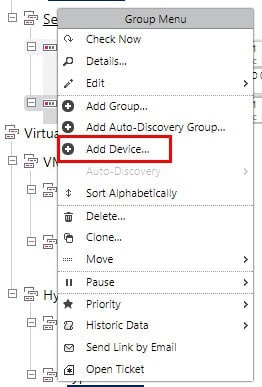
Due to my AWS setup, it will have taken a while for PRTG to scan the network to discover my Test Server. Instead of waiting, I can add a device to a particular group. To do that, right-click on the group you will like to add a device to (in my case, Servers), and select Add Device:
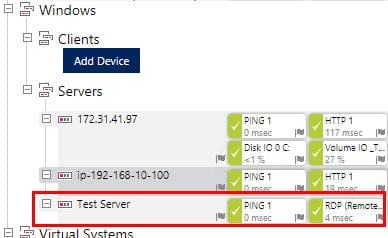
Fill the name of the device (Test Server), its IP address/DNS name (172.31.38.140), any tags you will like and an icon to be used.
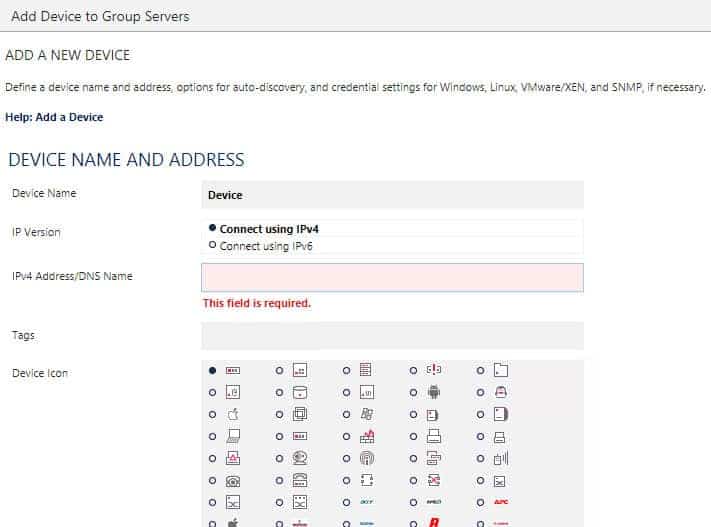
Note: If you make any mistakes here, you can always make changes later by right-clicking on the device, select Edit and click on Settings.
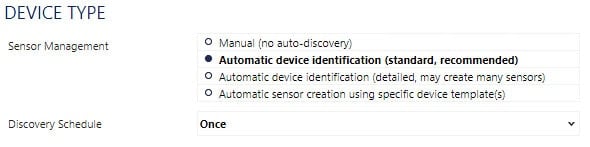
For the Sensor Management, I will still like PRTG to perform auto-discovery so I will select Automatic device identification (standard, recommended). If you will like to manually select the sensors to be used, you can leave it on Manual (no auto-discovery).
In my case, since I am not using Active Directory, I will also specify credentials for the Windows system. By default, the new device will try to inherit the value from what we configured during Smart Setup so I will need to uncheck that box and specify the correct credentials.
Note: If the system is not connected to AD, you will need to specify the computer name of the system.
After you add the device, wait until PRTG has performed auto-discovery on it (this can take a while). In my case, it only added two sensors: Ping and RDP:
Adding a Sensor
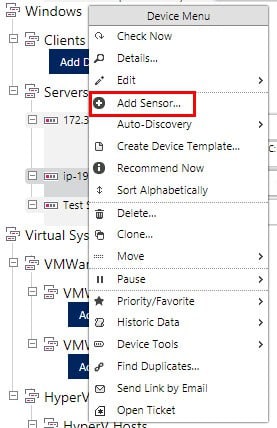
What if we want to add more sensors to this device so that other things can be monitored? Easy. Right-click on the device you will like to add a sensor for and select Add Sensor:
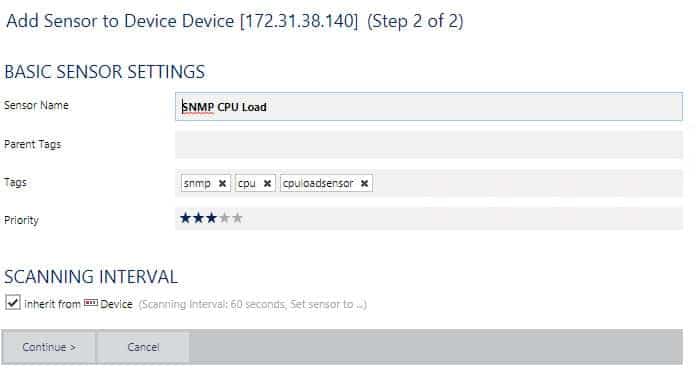
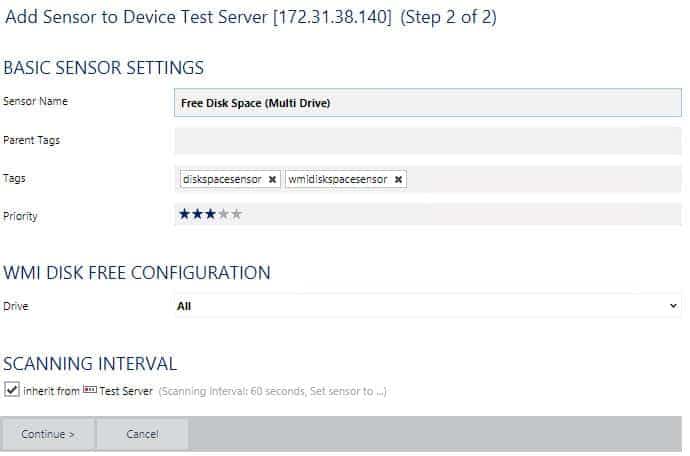
Search for the sensor you will like to add. For this article, I will like to add two sensors: SNMP CPU Load and WMI Free Disk Space (Multi Disk). I did this on purpose – one that uses SNMP and one that uses WMI.


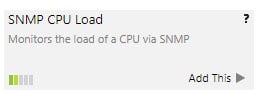


Click on the sensors, change any values you will like (or leave at default) and click Continue.
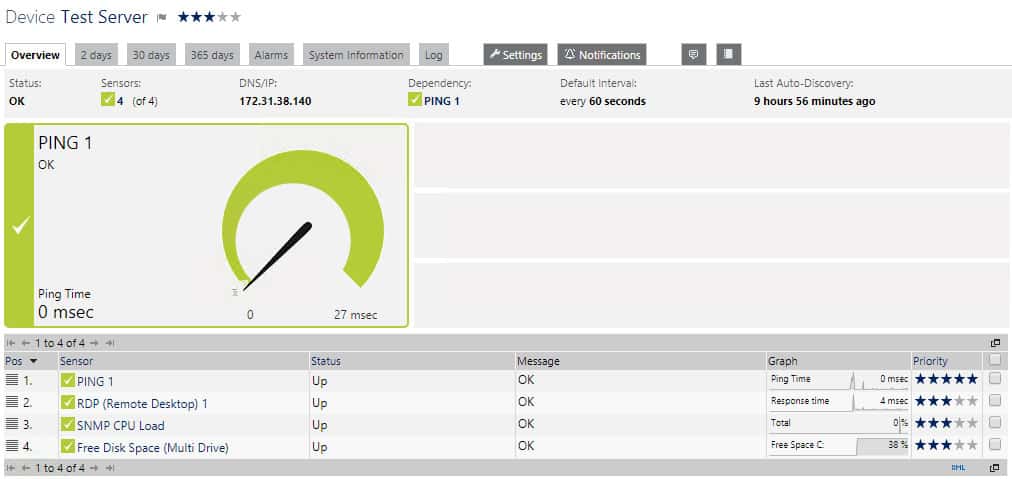
The image shows the state of the Test Server after the sensors have been running for a while.
Adding an Auto-Discovery Group
Instead of waiting for PRTG to discover my GNS3 topology (router), I can also add it manually. In this scenario, I will not be adding it as a device; instead, I can add an auto-discovery group and specify the IP addresses I want it to add.
Note: An auto-discovery group is like a normal group except that it will run auto-discovery on this group.
To get started, right-click on the parent group you will like to add a group to (I added mine under Network Infrastructure) and select Add Auto-Discovery Group:
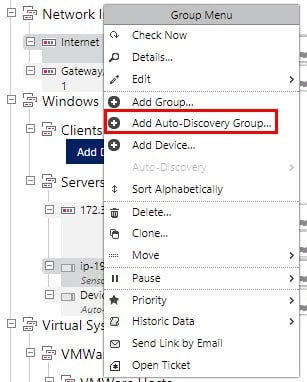
Fill the details of the group such as the name, the sensor management and how to select the devices to be added to the group. Since I know the IP address I want to use, I will choose List of individual IPs and DNS names (IPv4).
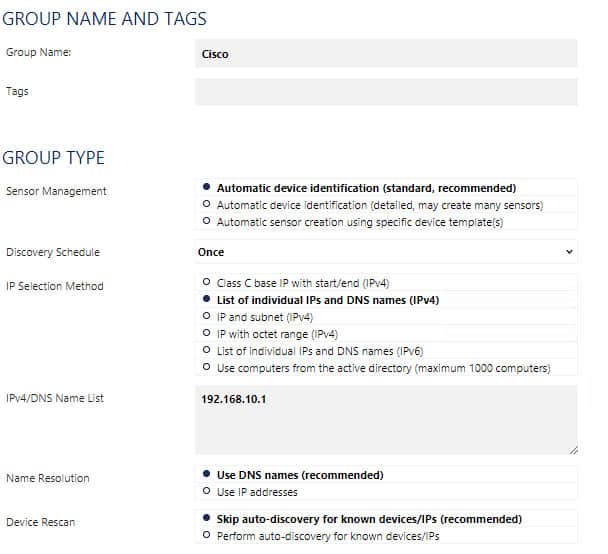
Shortcoming: PRTG does not have the option to specify a “seed device”. A seed device is one from which discovery can start and then the monitoring tool can hop to the neighbors of that seed device until the entire network is discovered.
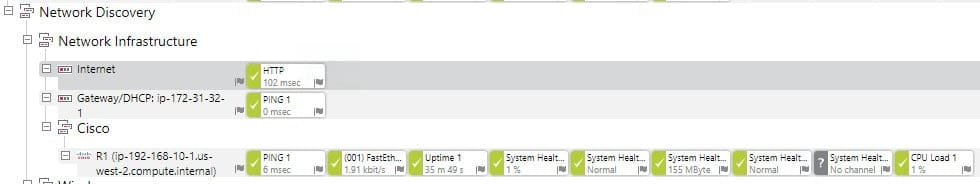
A little while after I added the group, PRTG discovered my router and added a couple of sensors to it.
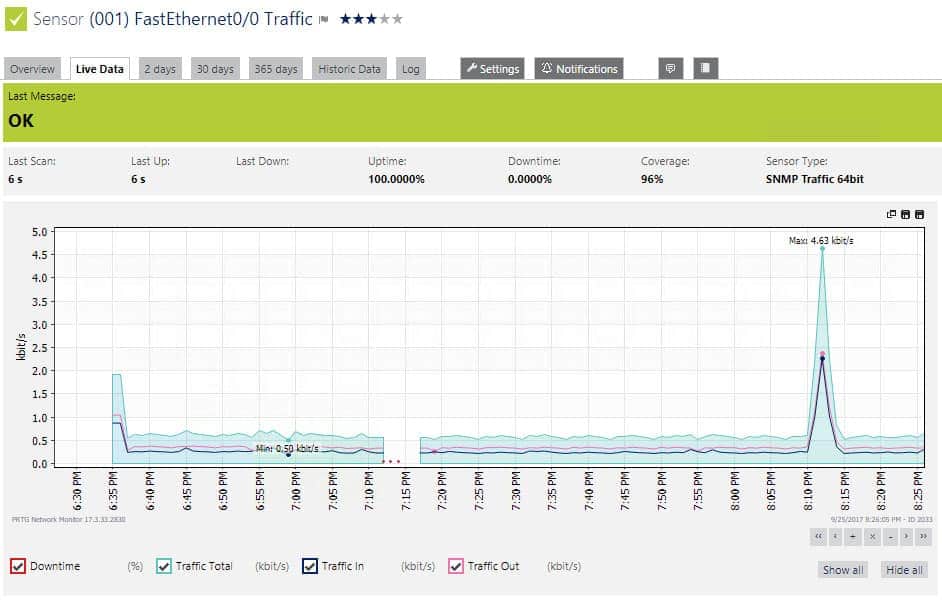
I can view the data from the SNMP traffic sensor monitoring the Fa0/0 interface. This is very useful for monitoring bandwidth utilization:
Notification
One of the most important things about monitoring is being notified when there is a problem. PRTG offers several notification methods including email, SMS, push notifications (on mobile apps), and assigning tickets.
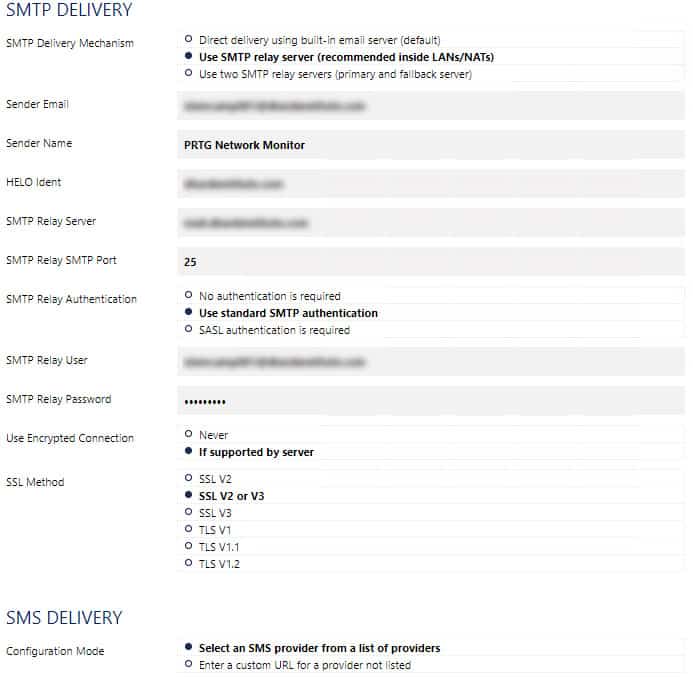
We can configure the setting for email and SMS by navigating to Setup, System Administration and selecting Notification Delivery.

In this article, we will be using the email notification method. Even though PRTG comes with a default in-built email server, it did not work on my AWS instance.
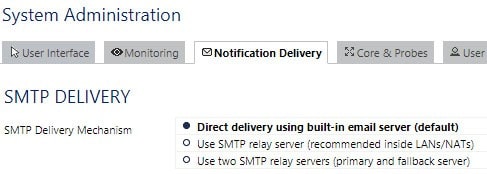
Therefore, I had to use the SMTP relay server option and configured the details of my own email server.
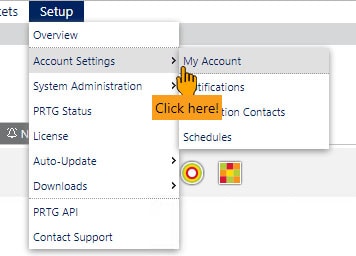
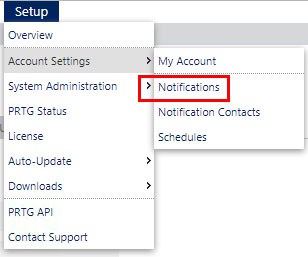
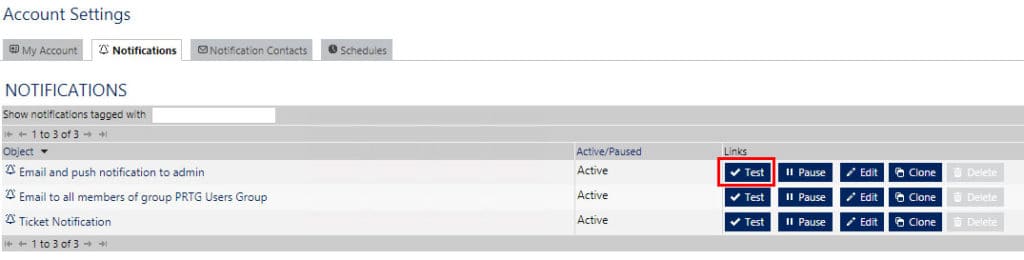
Once you configure your notification delivery, you can test it by navigating to Setup, Account Settings and select Notifications.
By default, PRTG sends email notifications to the PRTG admin (the email address you configured in settings). We can click on Test to see if email notifications work.
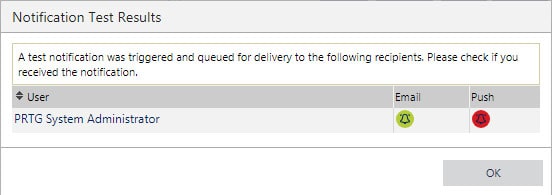
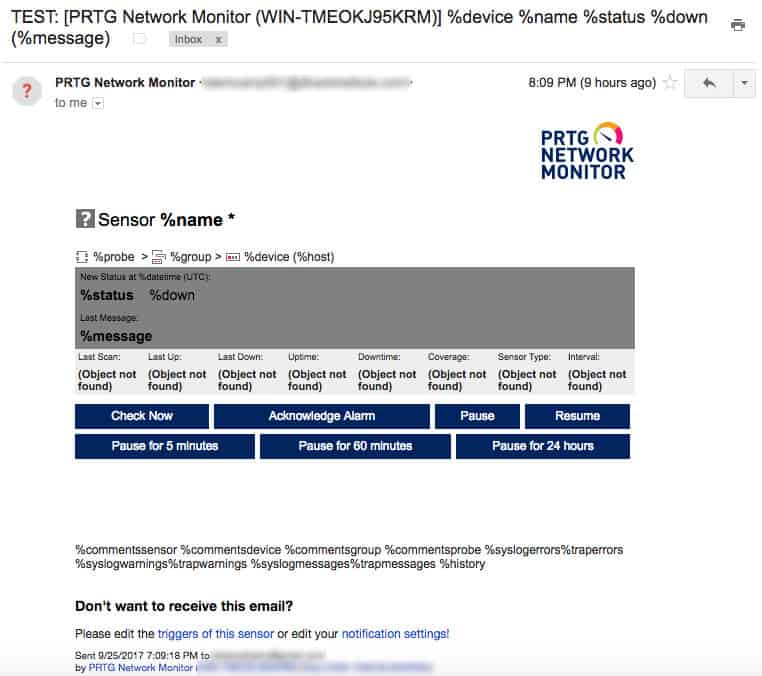
The test email I got is shown below:
Troubleshooting: If you don’t get the email, you can check what went wrong by clicking on Logs at the top of the web interface.
![]()
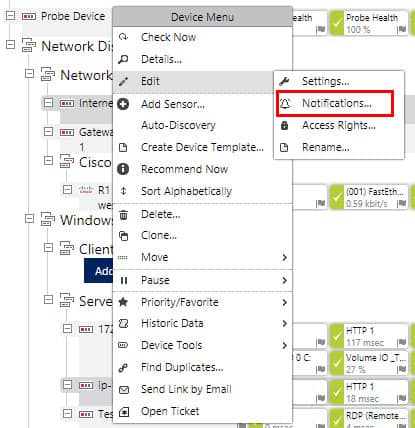
Now that we know notification is working, let us simulate a network outage on R1. Before we bring R1 down, let us change what triggers a notification on this device. To do this, right-click on the device in the device tree, go to Edit and select Notifications:
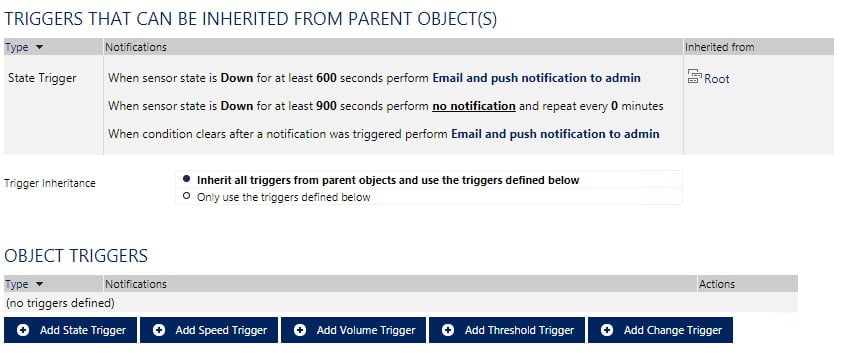
By default, when a sensor goes down for at least 600 seconds (10 minutes), an email/push notification is sent to admin. When the problem clears, another email/push notification is sent.
10 minutes is too long for our purposes. Let us add another trigger that sends an email after 1 minute of R1 being down. To do that, click on Add State Trigger and specify 60 seconds after a sensor is down and the action should be “Email and push notification to admin”:
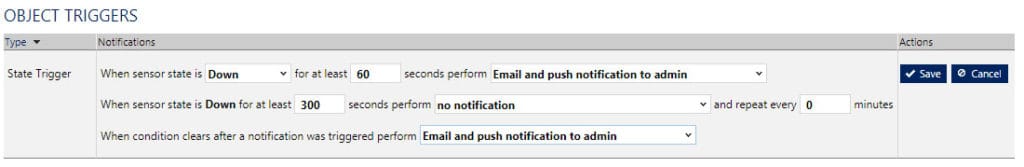
Click Save when done. By default, this trigger will now be enabled along with any one inherited from the parent object. You can choose the option to only use the triggers you defined if you so wish.
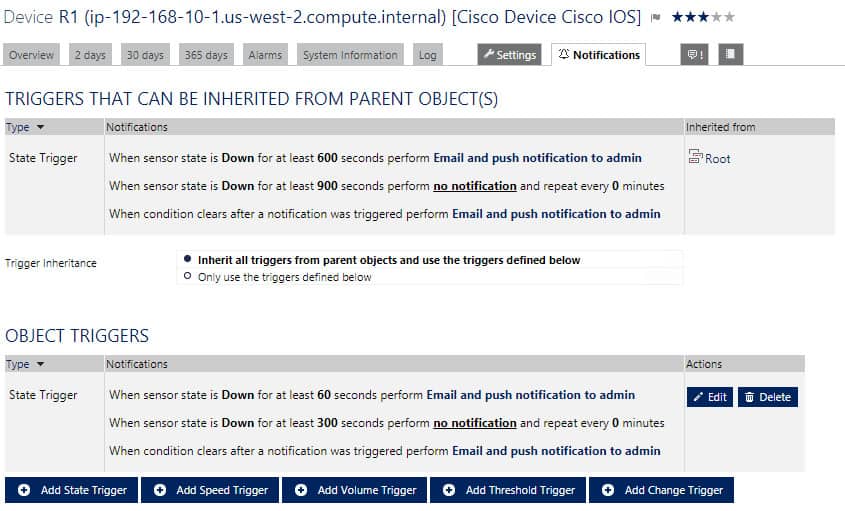
Note: PRTG uses the concept of inheritance a lot so that you don’t have to keep redefining things for each object/device. This means that all the trigger we just created has also been inherited by the sensors on R1.
Now that we have defined everything, let us trigger the notification by shutting down the Fa0/0 interface of R1:
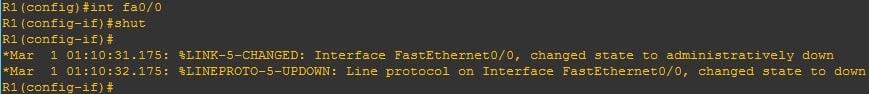
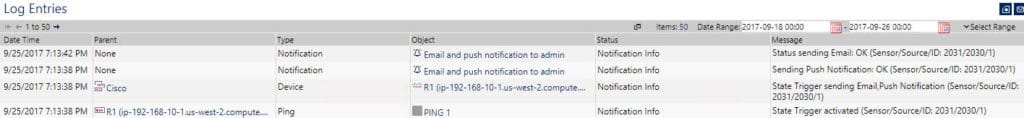
Once we shut down the interface, we can see from the PRTG logs that the sensor monitoring that interface has reported the outage.
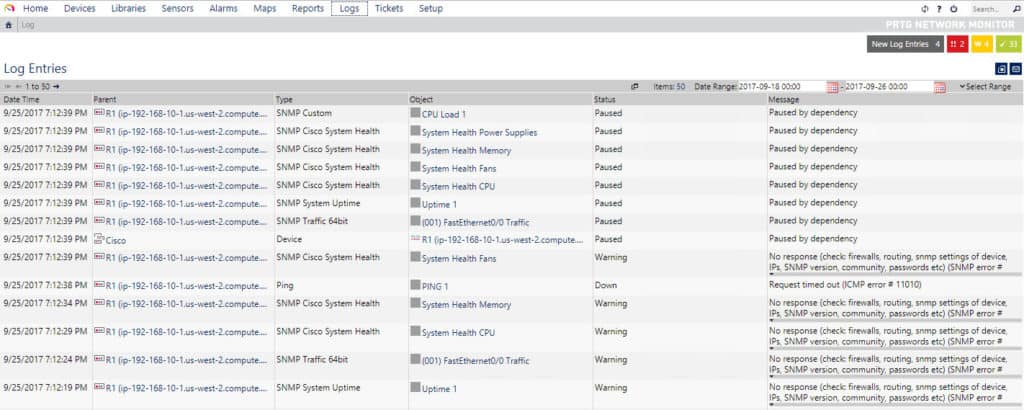
We can also double click on a log to view more details:
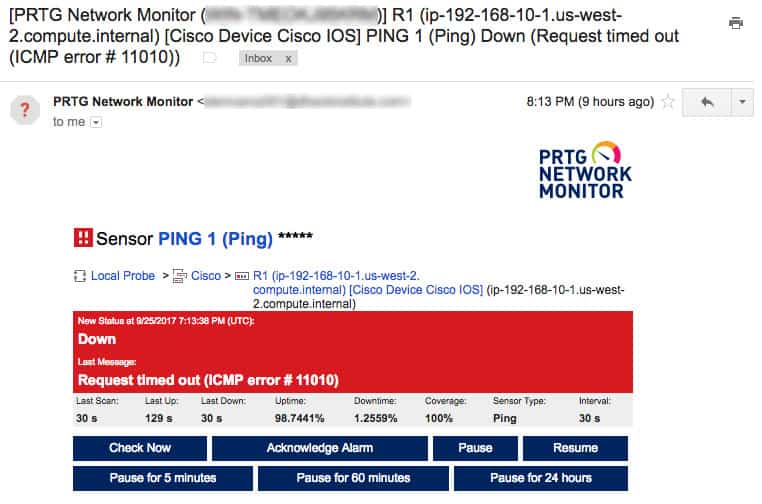
After 60 seconds, we see that the trigger is activated and an email is sent.
Some part of the email that I received is as shown below:
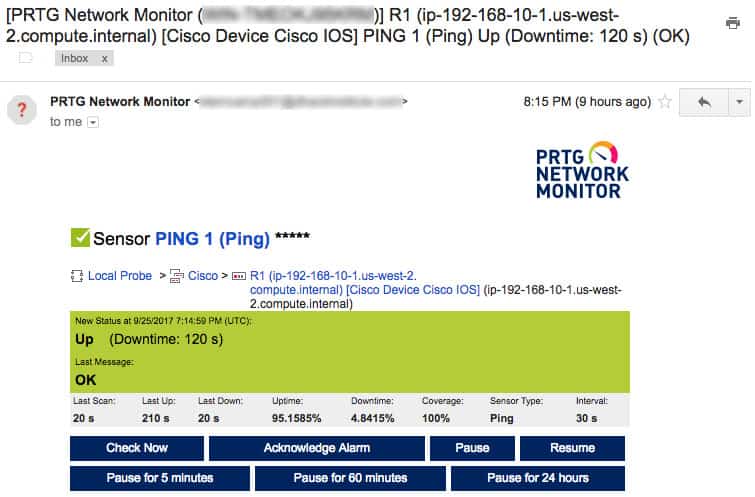
Let’s bring the interface back up and I should receive another email notification telling me everything is fine.

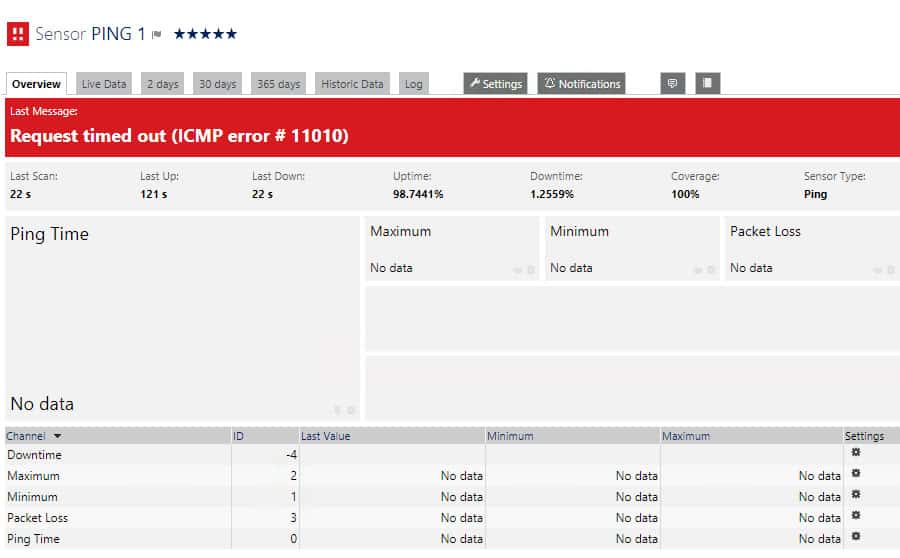
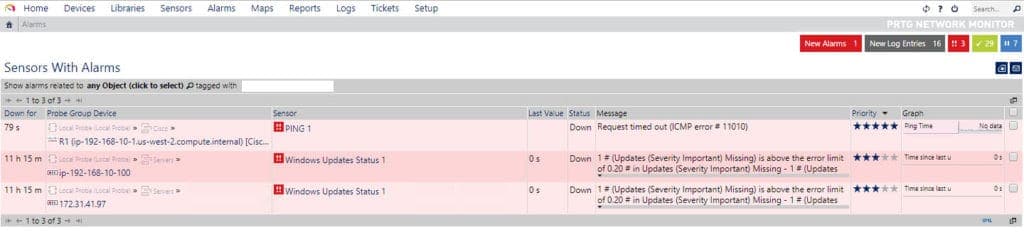
Before we leave this topic of notifications, let’s look at one more feature of PRTG which is Alarms. While Logs will show you everything that is happening on PRTG, Alarms will only show you sensors that are in the error or warning state. For example, when we shut the interface of R1 down, it showed up in the Alarms page:
Paessler PRTG Network Monitor Pros & Cons
Pros:
- Uses a combination of packet sniffing, WMI, and SNMP to report network performance as well as discover new devices
- Autodiscovery reflects the latest inventory changes almost instantaneously
- Drag and drop editor makes it easy to build custom views and reports
- Supports a wide range of alert mediums such as SMS, email, and third-party integration
- Supports a freeware version
Cons:
- Is a very comprehensive platform with many features and moving parts that require time to learn
Conclusion
PRTG Network Monitor is one of the easiest network monitoring tools to use. As we saw in this article, the installation is very simple and it can run on a modest amount of hardware/software resources. Installation is as easy as Next-Next after which PRTG can automatically discover your network and get you up and running in a few minutes.
PRTG Network Monitor can get really granular and sometimes you forget what part of the interface you are and how to get back to the main page. However, when you get a hang of it (after a couple of hours of use), using it becomes a breeze.
In this article, we have covered the basics of monitoring like auto-discovery, adding devices, groups and sensors, and notifications. However, PRTG can do more advanced things like distributed monitoring, generating reports, customizing dashboards, creating custom sensors and so on.
While PRTG is a generally great tool, there are a few shortcomings like the fact that it cannot discover a network from one seed device. This feature is very useful especially on Cisco networks because you may not know the details of all the routes/devices that exist on a network. Another drawback is that it can sometimes be difficult to know why a sensor isn’t working (getting data) – is it the SNMP credentials or WMI not working, etc.
In conclusion, after reading our extensive PRTG Review, you can see it is a very useful tool for network monitoring and will not necessarily break the bank. Paessler freeware version of PRTG is available for use of up to 100 sensors. You can also download the fully-functional 30-day FREE Trial!
![]()
![]()
Related Post: Best Free Syslog Servers for Windows


![Toni Kroos là ai? [ sự thật về tiểu sử đầy đủ Toni Kroos ]](https://evbn.org/wp-content/uploads/New-Project-6635-1671934592.jpg)


