Convolutional neural networks: an overview and application in radiology – Insights into Imaging
This section introduces recent applications within radiology, which are divided into the following categories: classification, segmentation, detection, and others.
Mục Lục
Classification
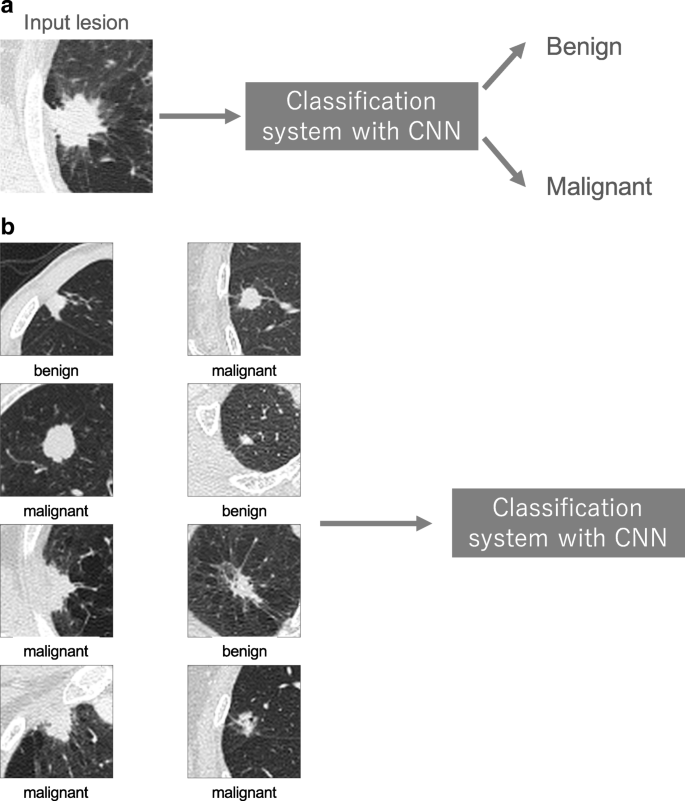
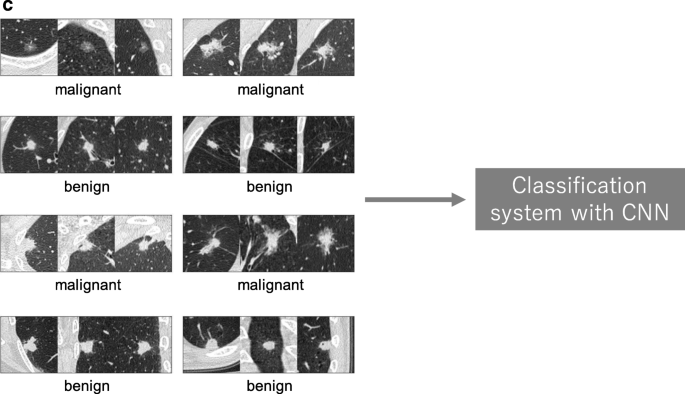
In medical image analysis, classification with deep learning usually utilizes target lesions depicted in medical images, and these lesions are classified into two or more classes. For example, deep learning is frequently used for the classification of lung nodules on computed tomography (CT) images as benign or malignant (Fig. 11a). As shown, it is necessary to prepare a large number of training data with corresponding labels for efficient classification using CNN. For lung nodule classification, CT images of lung nodules and their labels (i.e., benign or cancerous) are used as training data. Figure 11b, c show two examples of training data of lung nodule classification between benign lung nodule and primary lung cancer; Fig. 11b shows the training data where each datum includes an axial image and its label, and Fig. 11c shows the training data where each datum includes three images (axial, coronal, and sagittal images of a lung nodule) and their labels. After training CNN, the target lesions of medical images can be specified in the deployment phase by medical doctors or computer-aided detection (CADe) systems [38].
Fig. 11

A schematic illustration of a classification system with CNN and representative examples of its training data. a Classification system with CNN in the deployment phase. b, c Training data used in training phase
Full size image
Because 2D images are frequently utilized in computer vision, deep learning networks developed for the 2D images (2D-CNN) are not directly applied to 3D images obtained in radiology [thin-slice CT or 3D-magnetic resonance imaging (MRI) images]. To apply deep learning to 3D radiological images, different approaches such as custom architectures are used. For example, Setio et al. [39] used a multistream CNN to classify nodule candidates of chest CT images between nodules or non-nodules in the databases of the Lung Image Database Consortium and Image Database Resource Initiative (LIDC-IDRI) [40], ANODE09 [41], and the Danish Lung Cancer Screening Trial [42]. They extracted differently oriented 2D image patches based on multiplanar reconstruction from one nodule candidate (one or nine patches per candidate), and these patches were used in separate streams and merged in the fully connected layers to obtain the final classification output. One previous study used 3D-CNN for fully capturing the spatial 3D context information of lung nodules [43]. Their 3D-CNN performed binary classification (benign or malignant nodules) and ternary classification (benign lung nodule, and malignant primary and secondary lung cancers) using the LIDC-IDRI database. They used a multiview strategy in 3D-CNN, whose inputs were obtained by cropping three 3D patches of a lung nodule in different sizes and then resizing them into the same size. They also used the 3D Inception model in their 3D-CNN, where the network path was divided into multiple branches with different convolution and pooling operators.
Time series data are frequently obtained in radiological examinations such as dynamic contrast-enhanced CT/MRI or dynamic radio isotope (RI)/positron emission tomography (PET). One previous study used CT image sets of liver masses over three phases (non-enhanced CT, and enhanced CT in arterial and delayed phases) for the classification of liver masses with 2D-CNN [8]. To utilize time series data, the study used triphasic CT images as 2D images with three channels, which corresponds to the RGB color channels in computer vision, for 2D-CNN. The study showed that 2D-CNN using triphasic CT images was superior to that using biphasic or monophasic CT images.
Segmentation
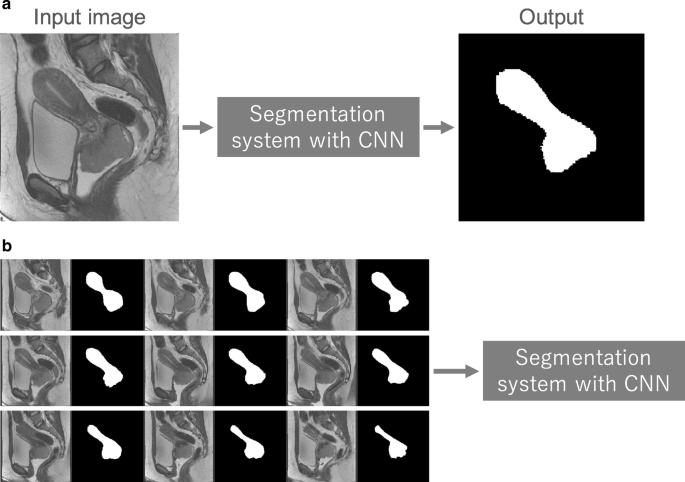
Segmentation of organs or anatomical structures is a fundamental image processing technique for medical image analysis, such as quantitative evaluation of clinical parameters (organ volume and shape) and computer-aided diagnosis (CAD) system. In the previous section, classification depends on the segmentation of lesions of interest. Segmentation can be performed manually by radiologists or dedicated personnel, a time-consuming process. However, one can also apply CNN to this task as well. Figure 12a shows a representative example of segmentation of the uterus with a malignant tumor on MRI [24, 44, 45]. In most cases, a segmentation system directly receives an entire image and outputs its segmentation result. Training data for the segmentation system consist of the medical images containing the organ or structure of interest and the segmentation result; the latter is mainly obtained from previously performed manual segmentation. Figure 12b shows a representative example of training data for the segmentation system of a uterus with a malignant tumor. In contrast to classification, because an entire image is inputted to the segmentation system, it is necessary for the system to capture the global spatial context of the entire image for efficient segmentation.
Fig. 12
A schematic illustration of the system for segmenting a uterus with a malignant tumor and representative examples of its training data. a Segmentation system with CNN in deployment phase. b Training data used in the training phase. Note that original images and corresponding manual segmentations are arranged next to each other
Full size image
One way to perform segmentation is to use a CNN classifier for calculating the probability of an organ or anatomical structure. In this approach, the segmentation process is divided into two steps; the first step is construction of the probability map of the organ or anatomical structure using CNN and image patches, and the second is a refinement step where the global context of images and the probability map are utilized. One previous study used a 3D-CNN classifier for segmentation of the liver on 3D CT images [46]. The input of 3D-CNN were 3D image patches collected from entire 3D CT images, and the 3D-CNN calculated probabilities for the liver from the image patches. By calculating the probabilities of the liver being present for each image patch, a 3D probability map of the liver was obtained. Then, an algorithm called graph cut [47] was used for refinement of liver segmentation, based on the probability map of the liver. In this method, the local context of CT images was evaluated by 3D-CNN and the global context was evaluated by the graph cut algorithm.
Although segmentation based on image patch was successfully performed in deep learning, U-net of Ronneberger et al. [48] outperformed the image patch-based method on the ISBI [IEEE (The Institute of Electrical and Electronics Engineers) International Symposium on Biomedical Imaging] challenge for segmentation of neuronal structures in electron microscopic images. The architecture of U-net consists of a contracting path to capture anatomical context and a symmetric expanding path that enables precise localization. Although it was difficult to capture global context and local context at the same time by using the image patch-based method, U-net enabled the segmentation process to incorporate a multiscale spatial context. As a result, U-net could be trained end-to-end from a limited number of training data.
One potential approach of using U-net in radiology is to extend U-net for 3D radiological images, as shown in classification. For example, V-net was suggested as an extension of U-net for segmentation of the prostate on volumetric MRI images [49]. In the study, V-net utilized a loss function based on the Dice coefficient between segmentation results and ground truth, which directly reflected the quality of prostate segmentation. Another study [9] utilized two types of 3D U-net for segmenting liver and liver mass on 3D CT images, which was named cascaded fully convolutional neural networks; one type of U-net was used for segmentation of the liver and the other type for the segmentation of liver mass using the liver segmentation results. Because the second type of 3D U-net focused on the segmentation of liver mass, the segmentation of liver mass was more efficiently performed than single 3D U-net.
Detection
A common task for radiologists is to detect abnormalities within medical images. Abnormalities can be rare and they must be detected among many normal cases. One previous study investigated the usefulness of 2D-CNN for detecting tuberculosis on chest radiographs [7]. The study utilized two different types of 2D-CNN, AlexNet [3] and GoogLeNet [32], to detect pulmonary tuberculosis on chest radiographs. To develop the detection system and evaluate its performance, the dataset of 1007 chest radiographs was used. According to the results, the best area under the curve of receiver operating characteristic curves for detecting pulmonary tuberculosis from healthy cases was 0.99, which was obtained by ensemble of the AlexNet and GoogLeNet 2D-CNNs.
Nearly 40 million mammography examinations are performed in the USA every year. These examinations are mainly performed for screening programs aimed at detecting breast cancer at an early stage. A comparison between a CNN-based CADe system and a reference CADe system relying on hand-crafted imaging features was performed previously [50]. Both systems were trained on a large dataset of around 45,000 images. The two systems shared the candidate detection system. The CNN-based CADe system classified the candidate based on its region of interest, and the reference CADe system classified it based on the hand-crafted imaging features obtained from the results of a traditional segmentation algorithm. The results show that the CNN-based CADe system outperformed the reference CADe system at low sensitivity and achieved comparable performance at high sensitivity.
Others
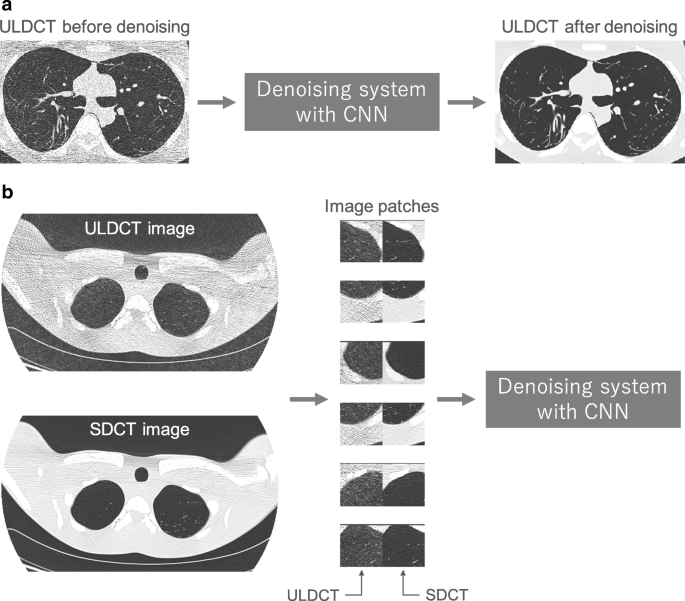
Low-dose CT has been increasingly used in clinical situations. For example, low-dose CT was shown to be useful for lung cancer screening [51]. Because noisy images of low-dose CT hindered the reliable evaluation of CT images, many techniques of image processing were used for denoising low-dose CT images. Two previous studies showed that low-dose and ultra-low-dose CT images could be effectively denoised using deep learning [52, 53]. Their systems divided the noisy CT image into image patches, denoised the image patches, then reconstructed a new CT image from the denoised image patches. Deep learning with encoder–decoder architecture was used for their systems to denoise image patches. Training data for the denoising systems consisted of pairs of image patches, which are obtained from standard-dose CT and low-dose CT. Figure 13 shows a representative example of the training data of the systems.
Fig. 13
A schematic illustration of the system for denoising an ultra-low-dose CT (ULDCT) image of phantom and representative examples of its training data. a Denoising system with CNN in deployment phase. b Training data used in training phase. SDCT, standard-dose CT
Full size image
One previous study [54] used U-net to solve the inverse problem in imaging for obtaining a noiseless CT image reconstructed from a subsampled sinogram (projection data). To train U-net for reconstructing a noiseless CT image from the subsampled sinogram, the training data of U-net consist of (i) noisy CT images obtained from subsampled sinogram by filtered backprojection (FBP) and (ii) noiseless CT images obtained from the original sinogram. The study suggested that, while it would be possible to train U-net for reconstructing CT images directly from the sinogram, performing the FBP first greatly simplified the training. As a refinement of the original U-net, the study added a skip connection between the input and output for residual learning. Their study showed that U-net could effectively produce noiseless CT images from the subsampled sinogram.
Although deep learning requires a large number of training data, building such a large-scale training data of radiological images is a challenging problem. One main challenge is the cost of annotation (labeling); the annotation cost for a radiological image is much larger than a general image because radiologist expertise is required for annotation. To tackle this problem, one previous study [55] utilized radiologists’ annotations which are routinely added to radiologists’ reports (such as circle, arrow, and square). The study obtained 33,688 bounding boxes of lesions from the annotation of radiologists’ reports. Then, unsupervised lesion categorization was performed to speculate labels of the lesions in the bounding box. To perform unsupervised categorization, the following three steps were iteratively performed: (i) feature extraction using pretrained VGG16 model [30] from the lesions in the bounding box, (ii) clustering of the features, and (iii) fine-tuning of VGG16 based on the results of the clustering. The study named the labels obtained from the results of clustering as pseudo-category labels. The study also suggested that the detection system was built using the Faster R-CNN method [56], the lesions in the bounding box, and their corresponding pseudo-category. The results demonstrate that detection accuracy could be significantly improved by incorporating pseudo-category labels.
Radiologists routinely produce their reports as results of interpreting medical images. Because they summarize the medical images as text data in the reports, it might be possible to collect useful information about disease diagnosis effectively by analyzing the radiologists’ reports. One previous study [12] evaluated the performance of a CNN model, compared with a traditional natural language processing model, in extracting pulmonary embolism findings from chest CT. By using word embedding, words in the radiological reports can be converted to meaningful vectors [57]. For example, the following equation holds by using vector representation with word embedding: king – man + woman = queen. In the previous study, word embedding enabled the radiological reports to be converted to a matrix (or image) of size 300 × 300. By using this representation, 2D-CNN could be used to classify the reports as pulmonary embolism or not. Their results showed that the performance of the CNN model was equivalent to or beyond that of the traditional model.


![Toni Kroos là ai? [ sự thật về tiểu sử đầy đủ Toni Kroos ]](https://evbn.org/wp-content/uploads/New-Project-6635-1671934592.jpg)


