Business Model Canvas Presentation Template
RESOURCE
Mục Lục
Business Model Canvas


Download and customize this and 500+ other business templates

Explainer
Preview


Synopsis
What’s the best way to showcase a business idea? In this article, we’ll explain what a Business Model Canvas is, how to use it, how to customize our template to create your own, and if you read until the end, you’ll learn how LinkedIn uses a Business Model Canvas to create and assess new business ideas. Our customizable template includes some of the best Business Model Canvas tools available today, such as multiple canvas formats, RFM analysis, Cost structure and revenue streams, Key activities and resources, Channels, and twenty-five other tools.
Download and customize this and 500+ other business templates

Tool highlights
Business model canvas
A business model canvas is a shared language that is used to describe, visualize, and change a business model. In The Business Model Generation, Alexander Osterwalder says that “without a shared language, it is difficult to systematically challenge assumptions about one’s business model and innovate successfully.” The canvas describes how a company Creates, Delivers, and Captures value. This presentation has five versions of the business model canvas to fit your needs. A standard business model canvas comprises nine building blocks: key partners, key activities, key resources, value propositions, customer relationships, channels, customer segments, cost structures, and revenue streams. (Slide) 4
An alternative visualization uses post-it notes to organize the canvas. The user can also easily copy-paste the notes to add more if needed. Each one can be filled in, thrown out, or replaced for a manageable way to try out new ideas. (Slide 3)
The lean business model canvas is most useful for startups who need to quickly generate and assess different plans, as it includes problem and solution sections to help compare alternative ideas. (Slide 7)
RFM analysis
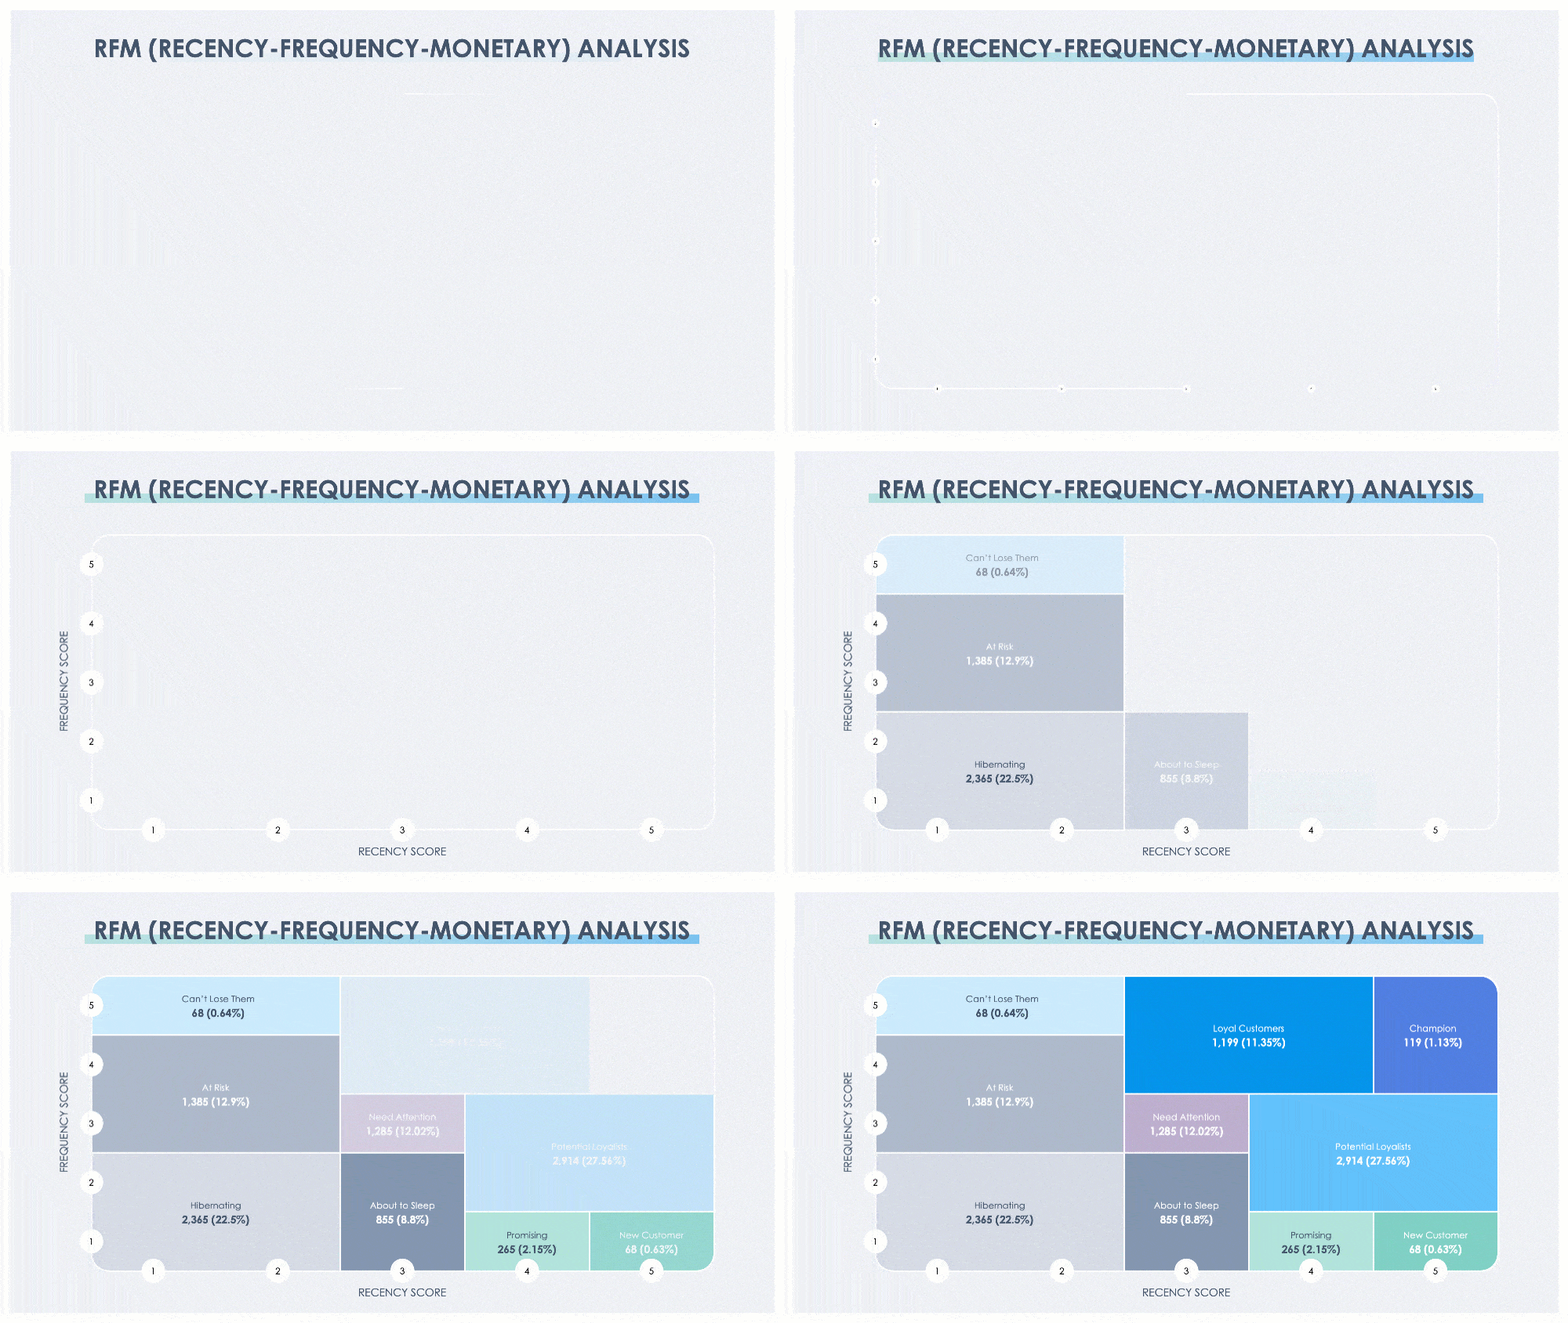
Companies need to know who they plan to cater to before they can develop a relationship with their customers. That’s where RFM analysis comes in. RFM stands for recency, frequency, and monetary, a unique framework for visualizing demographic information. Customers are scored according to the recency of their engagement scored on the X-axis, with the frequency of their purchases or engagement on the Y-axis. 1 is a low frequency or recency, while 5 represents a high frequency or recency. (Slide 10)
By plotting customers on this chart, you can see their monetary value and their importance to your organization. It’s a quantitative way to identify demographics in terms of how much money they can generate, as opposed to qualitative demographics like age or gender. Another effective way to quantify customer relationships is with a customer satisfaction score. This score lets companies see which methods or channels are most in demand. For example, according to these sample satisfaction scores, it would be wise to allocate fewer resources to email and phone support and more to chat support. (Slide 17)
Download and customize this and 500+ other business templates

Cost structure
Another key part of a business model canvas is to break down the cost structure of your business. This cost structure tree diagram visualizes the expenses, COGS, and gross and net profits in relation to sales. Since some organizations may have more overhead expenses to visualize than others, users can add or delete as many of the pie charts as necessary. (Slide 28)
The revenue stream diagram here divides revenue between different sources. Each source or category is allotted a percentage, with subcategories below each one. For example, a company like Apple might separate revenue streams into different types of physical goods and different kinds of services, while a company like Spotify might use ad revenue as one stream and subscriptions as another. (Slide 11)
Key activities
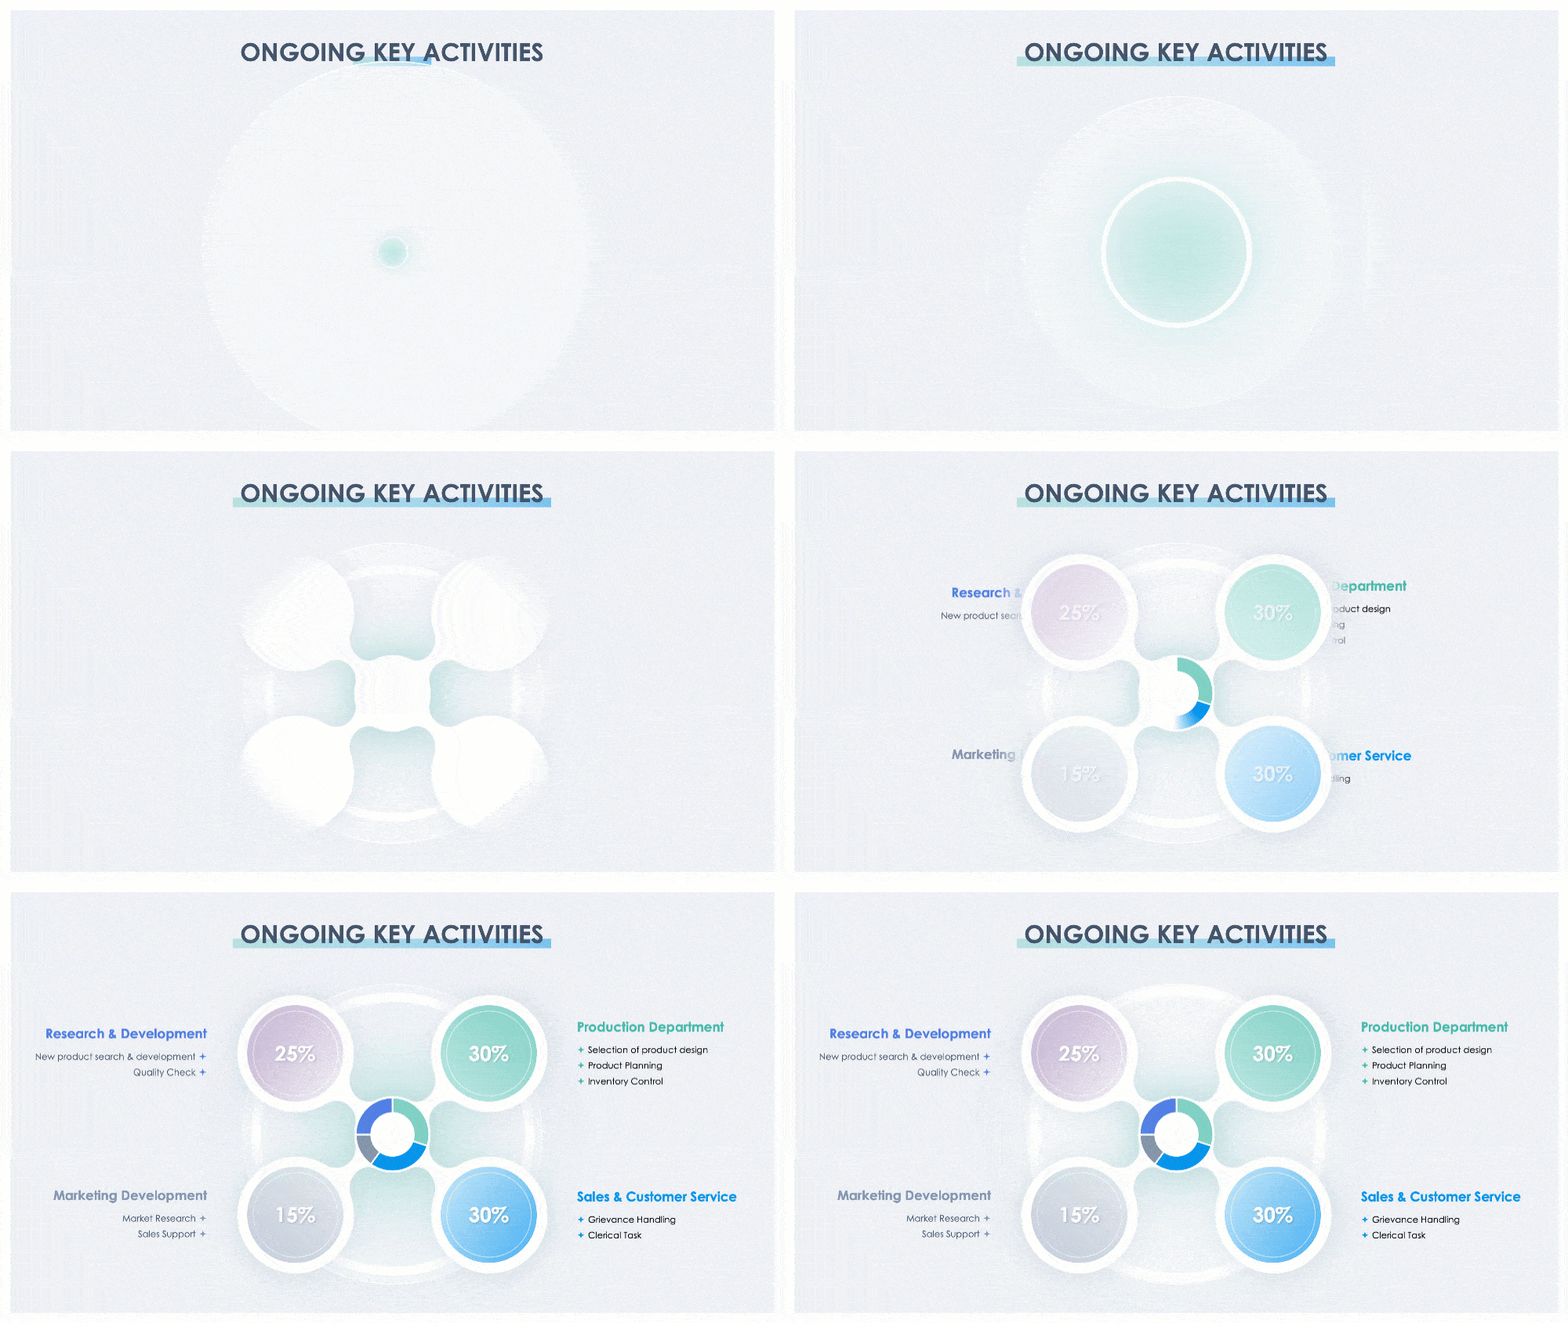
Key activities are another important building block of the business canvas. Key activities can be separated into ongoing activities that are repeated on a recurring basis or one-off activities that need to be accomplished only a handful of times a year. (Slide 20-21)
Key resources are what make the key activities possible. They are separated into physical, intellectual, human, and financial resources. Physical resources include everything from factories to equipment, while intellectual typically includes patents. Human includes all types of employees, and Financial includes private capital, any subsidies, or grants. List the amount dedicated to each resource and the expected ROI of each. Users can leave any of these blank if they are unsure of the value. For example, since governments plan to invest more in new energy vehicle development over the next decade, a vehicle company might highlight government subsidies as a key financial resource. (Slide 23)
Download and customize this and 500+ other business templates

Channels
The last part of the business canvas we’ll highlight are the channels. Channels cover how and where businesses deliver their value to customers. Distribution channels are where products or services can be sold. Each type of distribution can be compared here. (Slide 14)
Marketing channels are how companies get the word out and deliver their message or value proposition. A clear dashboard visualization is provided here. For a more detailed look at how to create a marketing plan to activate your marketing channels, check out our Marketing Plan presentation template and watch the accompanying video to learn more. (Slide 15)
Finally, support channels are important to maintain post-sales relationships. A strong support channel provides a competitive advantage. Companies such as Slack or IBM are known for their ongoing support to customers, which is what keeps customers coming back. (Slide 16)
LinkedIn business case
LinkedIn currently has over 650 million users from over 200 countries. LinkedIn’s key partners include data centers to support the online platform, employers, universities, and educational course developers. LinkedIn’s key activities include the maintenance of its online platform, retaining its user base, and building partnerships. Its key resource is, of course, the online platform itself.
LinkedIn has multiple customer segments: its community of users, employers in search of employees, and advertisers. Each of these segments has its own value proposition, which can be displayed on the canvas. For users, the proposition would be a way to display their skills to recruiters easily. For employers, it’s a global and accessible database of candidates. For advertisers, it’s an engaged audience and measurement tools.
Download and customize this and 500+ other business templates

LinkedIn’s biggest distribution channel is its website and mobile app. But its channels go beyond that, with support channels such as Sales Navigator and Sales Solutions that seek to maintain customer relationships. Maintaining these relationships with the user base through support channels is a key way that LinkedIn grows its online community and gains a competitive advantage. Its revenue streams include pay-per-click job postings, premium subscriptions, and marketing solutions. Each of these components can be listed out in the business model canvas and swapped in or out as they are evaluated for success. Check out our video above to see how all this looks on a business model canvas.
Want an easy-to-use Business Model Canvas? Download the Business Model Canvas presentation for more slides such as Key partner strategy, Key partner evaluation, Customer segmentation chart, Value creation strategy, Lean business model canvas, plus many more. And, if you want more business canvas visualizations, you can check out our other Business Canvas Collection for more.
Download and customize this and 500+ other business templates


![Toni Kroos là ai? [ sự thật về tiểu sử đầy đủ Toni Kroos ]](https://evbn.org/wp-content/uploads/New-Project-6635-1671934592.jpg)


