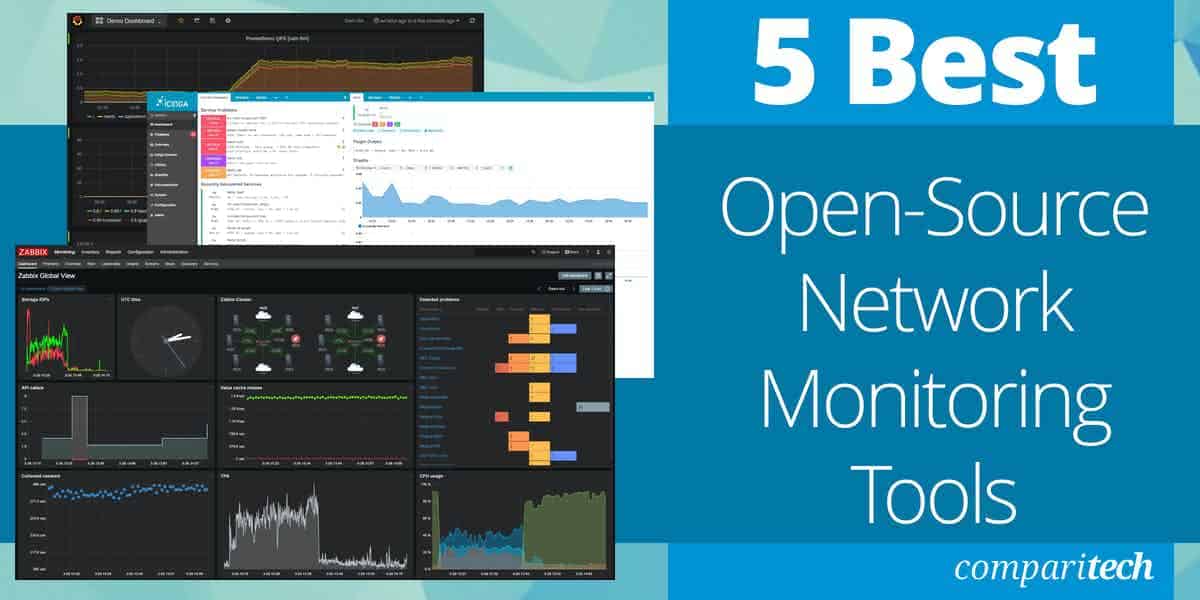
5 Best Open-Source Network Monitoring Tools for 2023 with Links

We’ve already covered the best network monitoring tools, but we’ll be showing the open-source community some love in the article. Then, we’ll touch on why you might want to choose an open-source tool and explore the best open-source network monitoring tools on the market today.
Here is our list of the best open-source network monitoring tools:
- Zabbix
EDITOR’S CHOICE
The best overall balance between open-source flexibility, support, and out-of-the-box ease of use. - Icinga Great API and documentation.
- Prometheus Uses a powerful query language to generate insights and display data.
- Nagios Offers both paid and free open source networking monitoring tools.
- Cacti Highly customizable, great for operations leveraging big data.
Open source tools provide better visibility and customization options to organizations that value flexibility over a “done for you” experience. When tools are open source, any developer can view and modify the code to their liking. This transparency creates plugins, community-driven features, and continuous testing of the code’s stability and security.
Frequently, open-source means the product is free. This can provide enterprise-level tools and features to smaller businesses and non-profit organizations that otherwise couldn’t afford access. But calling open source tools free is misleading.
Many times open source tools have hidden costs down the line that you should be aware of. The more an organization relies on open-source technology, the more expensive it can support it. For example, if your open source network monitoring tool suddenly breaks, there’s no vendor support line to call for help.
Instead, you’ll need to ensure staff are well trained on the product and can resolve the issue. This can take a lot of time and, subsequently, human resources. What’s even more costly is hiring an expert consultant to fix the problem, that is, if experts on that product even exist.
With open-source software, you don’t have to worry about a vendor going out of business or being acquired by another company that wants to kill the product. Many times I’ve seen great products become unusable because a new owner mismanaged them. With open-source, you’re in control. Companies often rely on the products community for support, bug fixes, and features, but this can be dangerous.
Communities can slowly dissolve over time, leaving the product in an orphaned state. If this occurs, you’ll need to make sure your staff is experienced enough to resolve issues without the help of others.
There are pros and cons to running an open-source tool. Understanding the risks and rewards of doing so will help you know if it’s the right choice for your organization.
Mục Lục
Our methodology for selecting an open-source networking monitoring tool
We reviewed the market for open-source networking monitoring tools and analyzed the options based on the following criteria:
- A large and active user base or community
- Detailed knowledge base articles, help documents, or tutorials
- Integration support for other tools you may need, such as infrastructure monitoring
- Are there any known vulnerabilities? If so, why haven’t they been patched
- Organizations similar to yours that are using the same software
With that said, we’ve tested out some open-source network monitoring tools and created a list of our favorites.

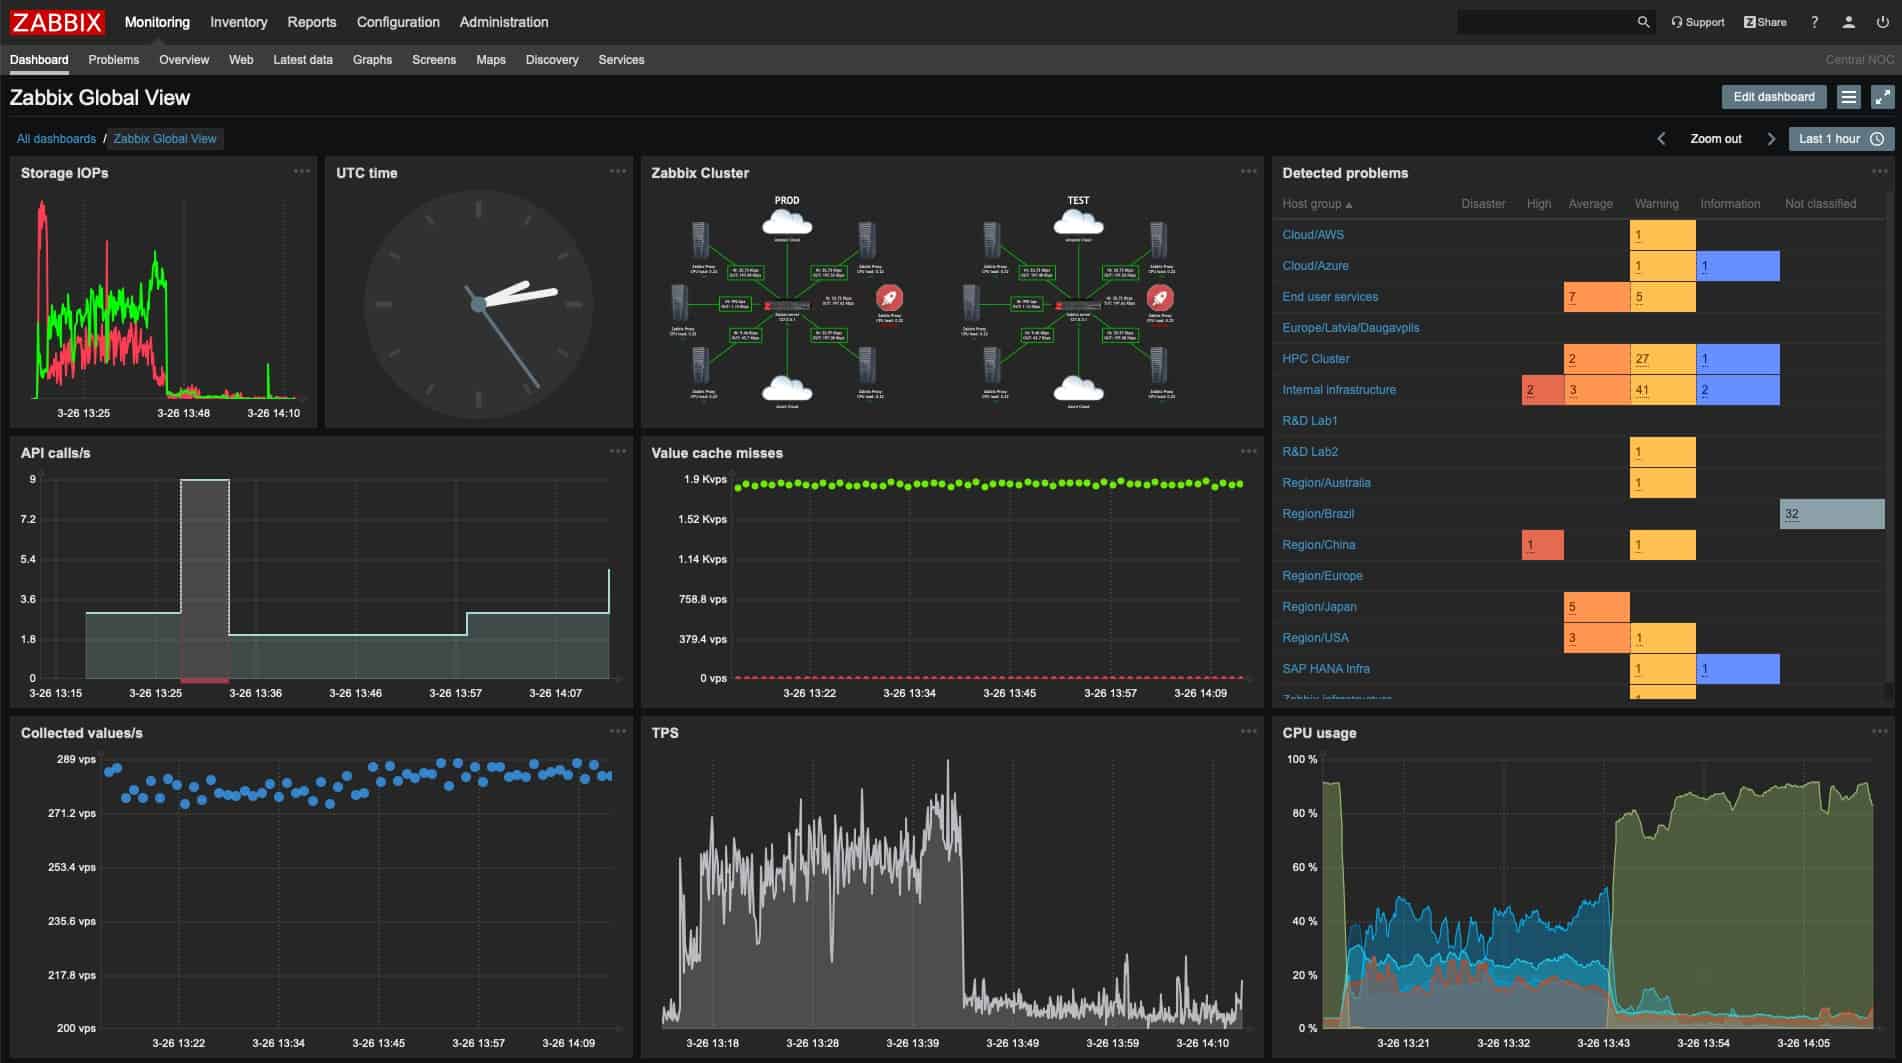
Zabbix is a powerful and popular open-source networking monitoring tool. It uses simple agents to collect SNMP and IPMP data to provide insights into different networks, applications, hosts, and cloud-based services. In addition, the platform uses a simple auto-discovery feature to detect new devices and changes on currently monitored assets.
Key Features:
- SNMP-based monitoring
- Automatic discovery
- Templates for product integrations
- User community support
- Cloud monitoring
There are numerous preconfigured templates to choose from that support major vendor solutions like Cisco, Dell, Intel, and Netgear, to name a few. For more obscure integrations, you can search the Zabbix community for assistance.
The community is strong with a Facebook group and Telegram chat supported in over nine different languages. There’s also the Zabbix support system, which acts as a live bug tracker. This system helps bring critical security vulnerabilities to the developers’ attention, ensuring the product is consistently reliable.
Visually the default interface is pretty solid but allows you to customize the view of your environment through widget-based apps. There are numerous options for remediation, alerts, and escalation that help highlight precisely what needs to be done to resolve an issue. In addition, Zabbix uses event correlation to help guide technicians in the right direction when fixing problems manually. Remediation can be automated via a script or be configured to create a helpdesk ticket via ITSM integration.
Pros:
- Open-source, transparent tool
- Uses both SNMP and ICMP for a broader monitoring range
- Can detect new devices and configuration changes immediately
- Offers useful templates for quick insights
- Robust notification system supports SMS, email, custom script, and webhook
Cons:
- Mastering the platform takes a long-term investment in terms of time
Overall, Zabbix is incredibly flexible with its open-source networking monitoring options and is supported by a large dedicated community that have continuously improved the platform over the years.
EDITOR’S CHOICE
Zabbix is our top pick for an open source network monitoring tool because this system is completely free to use but has all of the facilities that the top paid network monitoring packages offer. This system can be run on your own server or on a cloud platform account. You can use it to monitor multiple sites remotely, checking constantly on the internet links between them as well as network paths. The service can monitor virtualized and cloud systems as well as physical networks.
Download: Download this tool for free
Official Site: https://www.zabbix.com/download
OS: Linux, container, or cloud

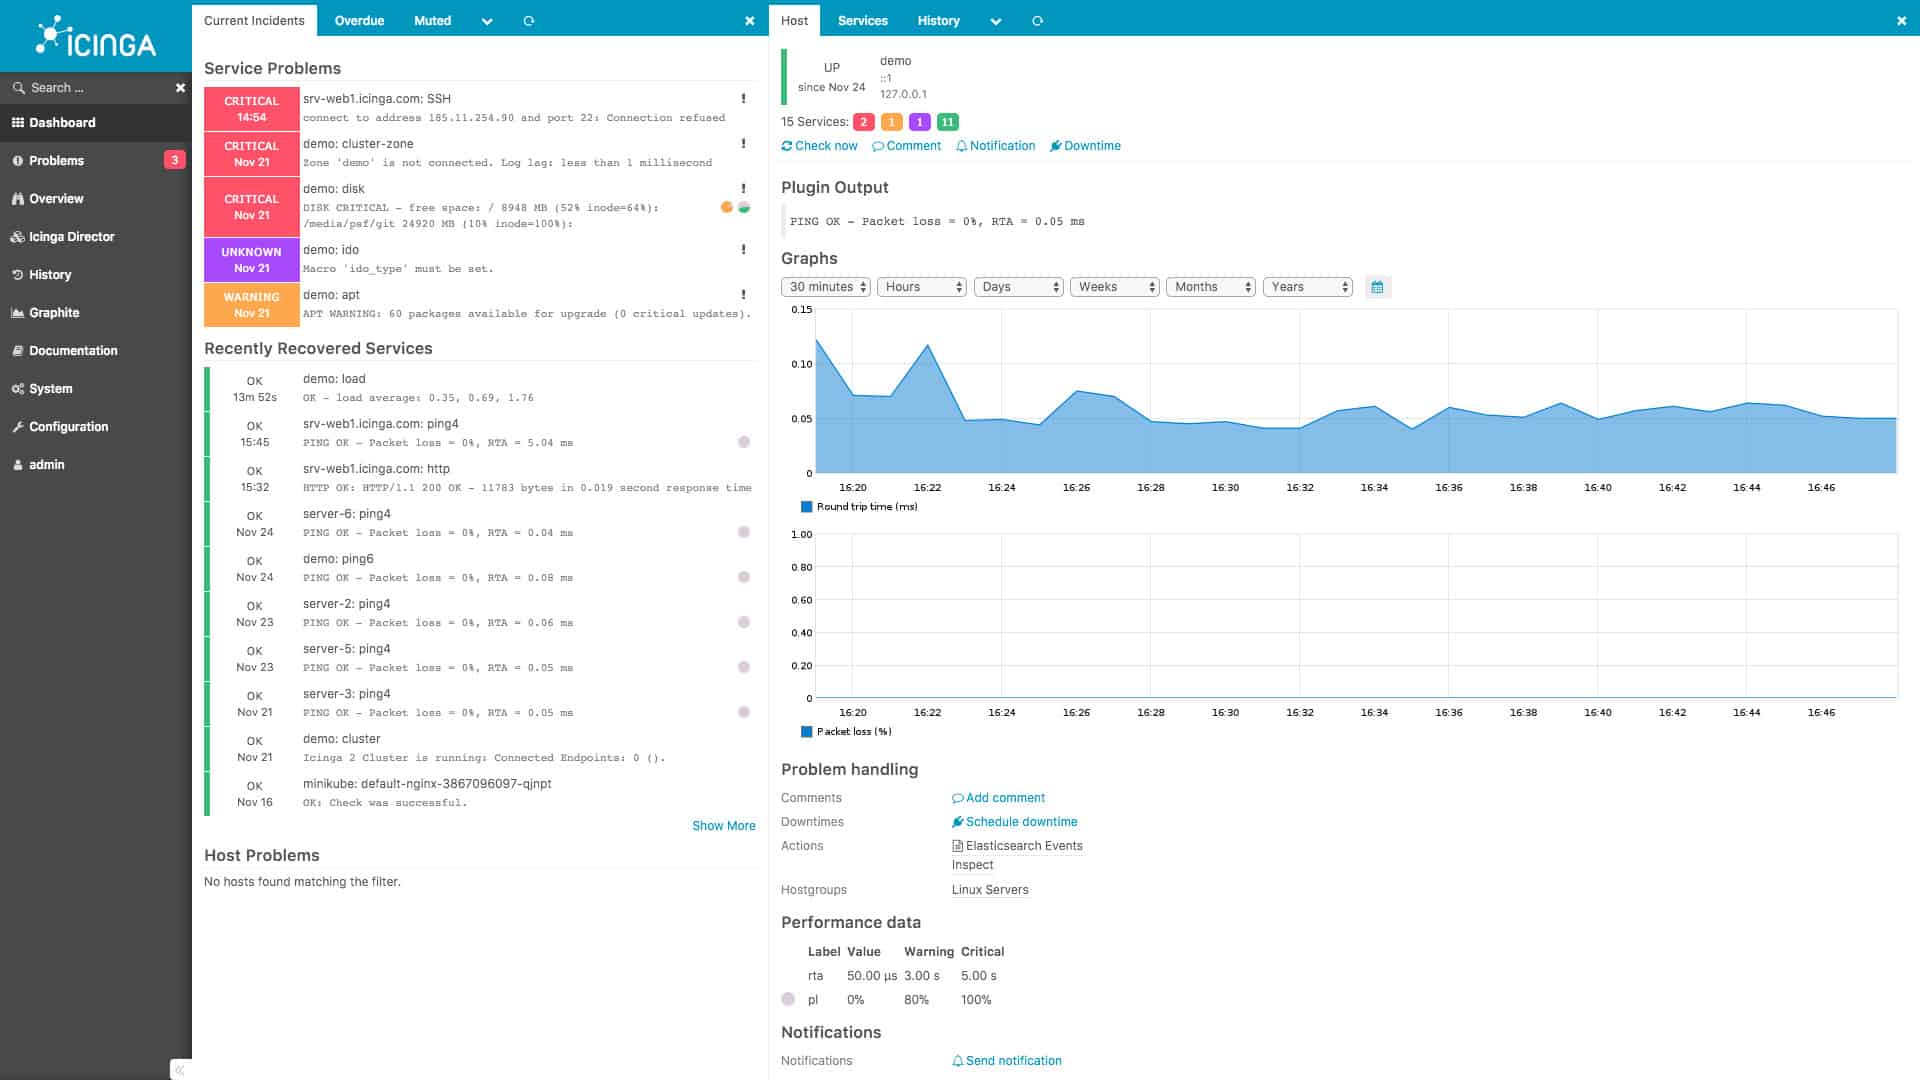
Icinga is an open-source platform that supports multiple tools, including a network monitoring solution. The tools are designed to seamlessly integrate, allowing organizations to gain complete visibility into their infrastructure, network, and metrics through the Icinga stack.
Key Features:
- Compatible with Nagios plug-ins
- Networks, servers, and applications
- Community support
- Cloud monitoring
The platform continues to receive updates and just recently supports several forms of agentless monitoring solutions. Icinga has proven itself a reliable open-source network monitoring tool and has been used by big brands such as Adobe, T-Mobile, and Siemens.
The platform offers network monitoring for both on-premises infrastructure as well as cloud-based solutions and containerized applications. While the cloud monitoring modules are separate from the infrastructure monitoring features, they can be accessed through the same platform.
The tool does a great job of easing you into its ecosystem. While many platforms try to throw a ton of options your way, Icinga makes it easy to start small and work your way up to more complicated monitoring integrations. In addition, there are numerous templates and support for vendor integrations; from HP to Cisco, the platform supports monitoring across hundreds of vendors.
While other platforms are hyper-focused on a single element of monitoring, Icinga works to provide complete infrastructure visibility across the network, making it easier to identify the source of a problem. The alert system is well built, and while it is customizable, it does offer a good starting point for anyone to get actionable insights right away.
Community support for Icinga is strong, offering support through multiple channels such as GitHub, web forums, Meetup, and even in-person events. I particularly like that they recognize lead developers in their community. Many times developers of sizeable open-source products go unthanked. Incinga has a page dedicated to frequent contributors to the platform. Icinga is a robust open-source networking monitoring tool that makes itself accessible to smaller businesses while still being reliable enough to be used in an enterprise environment.
Pros:
- Excellent API and documentation
- It can be configured via GUI or DSL, making it a good choice for admins who enjoy CLI tools
- Supports built-in visual reporting
- Modules allow for different functionality, keeping the base installation sleek and lightweight
- Can run on Linux as well as Windows operating systems
Cons:
- Higher learning curve than other tools
- Designed for more technical users, it can be challenging to implement without technical expertise

The Prometheus platform offers network monitoring and highly detailed visualization that are great for creating reports or displaying live metrics across your network operation center. The platform uses a PromQL to pull data and create visuals, making it highly flexible and favorable to those with query language experience.
Key Features:
- Good with Grafana frontend
- Flexible tool
- Customizable alerts
Visually, Prometheus is one of my favorite platforms in terms of looks and style. The interface is sleek and allows for numerous customization options with pre-configured views for those who don’t want to tinker. In addition, you can use Grafana to leverage their collection of shared dashboards if you don’t want to build your own.
Prometheus is one of the more popular open-source networking monitoring tools on the market, so its integrations are widely distributed. The platform is designed for monitoring but excels and displaying that monitoring data and recording it for long periods. Data can be stored locally on the disk and supports numerous remote storage options either in the cloud or through a NAS.
Alerts can be finely tuned to send messages across a number of platforms, fire off automation, or generate a service ticket for a help desk. However, this flexibility does come to a steep learning curve. I would like to see more templated alert options based on some popular Slack or well-known ITSM solutions. Prometheus is mighty but requires a talented sysadmin to harness its power truly. In terms of community Prometheus offers several channels, including a mailing list, Slack group, Twitter, and IRC (Yes, IRC isn’t dead!)
In addition to community support, the platform also promotes several paid training and commercial support options provided by third parties. I like this option as it gives organizations a platform to start training their internal staff in a more structured way than knowledge base articles can provide.
Prometheus is likely not a good fit for smaller organizations due to its complexity and specialization around big data. However, enterprise companies who can invest in talented staff to master the platform can easily reap the benefits Prometheus brings to the open source monitoring ecosystem.
Pros:
- Displays data beautifully and supports platforms such as Grafana
- Uses a powerful query language to derive insights and metrics
- Queries run very efficiently, use few resources
- Doesn’t rely on any external dependencies
Cons:
- Complex for new users requires a high degree of knowledge to use all of its features
- I would like to see more data pull methods, for example, the ability to draw from S3 buckets, etc.
- Initial setup and be cumbersome and time-consuming

Nagios provides a suite of open source tools that includes networking, infrastructure, and application monitoring. While the platform is open source, the only free version available is Nagios Core. Products like Nagios XI provide enterprise-level features, support, and more pre-made dashboards and alerts.
Key Features:
- Nagios Core is free to use
- Extensible with plug-ins
- The leading open-source network monitor
This model is quite lovely, as it allows companies to try the free version and then upgrade if needed. It also gives companies the option to switch to and from the paid model as they see fit. Nagios Core contains all the critical features for monitoring through a primary web interface.
Additional features such as graphing and reporting are all available through a plugin package. There are 50 core plugins in total which can all be downloaded at once. For additional integrations and feature, users can use the Nagios Exchange to find community creates add-ins. While Nagios Core is a great starting point, products like Nagios Fusion add features that help enable faster ticket resolution and highlight insights features in terms of the community; Nagios is over 250,000 strong, boasting one of the largest open source communities across the globe.
In addition, the platform has an active support forum, as well as paid options for support. While the paid support options are pretty expensive, they are likely cheaper than what it would cost to hire a consultant if things took a turn for the worst. Currently, phone support prices start at $1995 for a “5 call pack”, so make sure you’ve used all your free support resources first.
For new customers, Nagios does offer what is called “Nagios Quickstarts.” These are shorter free support sessions designed for prospective customers or new users to help customize deployments and fix any roadblocks they’re experiencing. More organizations should offer this approach; it allows new users to get onboarded and likely increases customer retention for Nagios.
Nagios offers some excellent open-source tools that help a ton of time for those using open-source networking monitoring tools that can afford it. On the flip side, Nagios Core is a solid foundation to build powerful networking monitoring features. However, like most open-source platforms Nagios, in general, does require significant time to learn the platform.
Pros:
- Multiple support options, including free onboarding assistance
- Alerts and insights are incredibly fast and work in near real-time
- Can monitor virtually anything, uses standard SNMP
Cons:
- I would like to see updated native graphics for metrics/reporting
- UI needs work, specifically when creating reports
- I would like to see more native support for features; many basic features are listed as plugins
- It can be highly customizable to a fault

Cacti is a highly customizable monitoring framework that offers networking graphing and data visualization capabilities. Similar to Prometheus, the platform is incredibly detailed and requires an experienced administrator at the helm to utilize all of its features thoroughly. Cacti can monitor networks and devices using multiple protocols, including SNMP, ICMP, and TCP/UDP availability checking. In addition, the platform provides device and network discovery automatically, making it a solid option for busy networks.
Key Features:
- SNMP monitoring
- Customizable
- Community support
While the platform can feel intimidating at times, more device and graphic templates are available for users to get started on the platform right away. Visually, Cacti is very green but other than the obvious color scheme; it is relatively easy to navigate. If you’re not a fan of green, there are six different themes to choose from that can all be customized as meticulously as you’d like,
The platform has dozens of plugins, all built off the Cati Framework, which essentially extends the platform’s capabilities. These plugins are created by the community as well as some of the lead developers of the platform.
In terms of community, I would like to see more up-to-date channels such as Slack or Discord. Currently, Cacti has a mailing list, web forum, and relatively detailed written documentation for support. Cacti do have a small number of video tutorials on their Youtube channel; however, there are only five at the time of this article.
Cacti is a great free option if you have someone on your team with the experience to implement and manage it. Additionally, organizations that want to take complete control over their network monitoring data and how it is visualized will enjoy the freedom that Cacti offers.
Pros:
- The sky’s the limit when it comes to customizations
- Multithreaded data collection can support network monitoring across thousands of devices
- Very detailed graphing and data visualization methods
Cons:
- Highly complex
- I would like to see more community platforms for users
- Video tutorials could go a long way to help new users
Which open source networking monitoring tool is right for you?
While there are quite a few tools to choose from, how do you know which one is right for you? Our top choice is Zabbix due to its ease of use and simple integrations into other platforms.
While some tools like Prometheus offer highly detailed graphing and query analysis, these features sometimes create complexity that keeps businesses away. Zabbix offers numerous out-of-the-box tools that allow you to get the platform working for you without having to spend a day setting it up.
Open source network monitoring FAQs
The primary element to look for in a network monitoring system is SNMP capabilities. This service allows the monitor to automatically identify all devices connected to the network and compile a network inventory. As SNMP cycles constantly, the inventory is always up to date. This service will receive notifications if any device experiences problems.
Why is network monitoring necessary?
Although network equipment from reputable suppliers can be expected to provide a reliable service, there are always the possibilities of problems. Configuration errors or capacity problems will cause networks to become overloaded and unavailable, bringing down all of the applications that your users need. It is important to be able to head off problems as soon as they arise.
Which protocol do we use for network monitoring?
The Simple Network Management Protocol (SNMP) is the standard facility used by network monitoring systems. SNMP provides an agent, which all network equipment manufacturers provide on their devices. All the system needs is an SNMP Manager, which broadcasts requests for reports. The agents listen for this trigger and then immediately send back a response, which is called a management information base (MIB). The MIBs allow the monitor to identify every device on the network, catalog their attributes, extract status reports, and record operational metrics.


![Toni Kroos là ai? [ sự thật về tiểu sử đầy đủ Toni Kroos ]](https://evbn.org/wp-content/uploads/New-Project-6635-1671934592.jpg)


