25+ Essential Business Travel Statistics [2023]: Facts About Business Travel In The U.S. – Zippia
Research Summary. Whether you’re flying out of town for that important business meeting or simply attending an annual workshop, business travel is an important part of any big company’s protocol. When it comes to business travel, our extensive research shows that:
-
Business travel in the U.S. from domestic and international travelers amounts to around $334.2 billion in annual revenue.
-
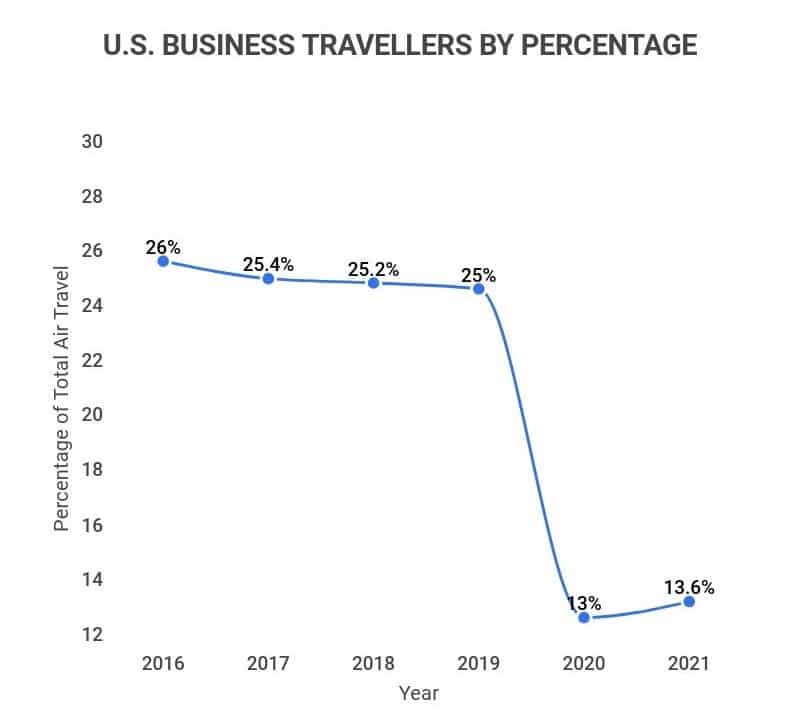
While business trips currently account for roughly 13.6% of total U.S. air travel, they make up to 75% of airlines’ profits.
-
At least 35% of U.S. businesses engage in business travel.
-
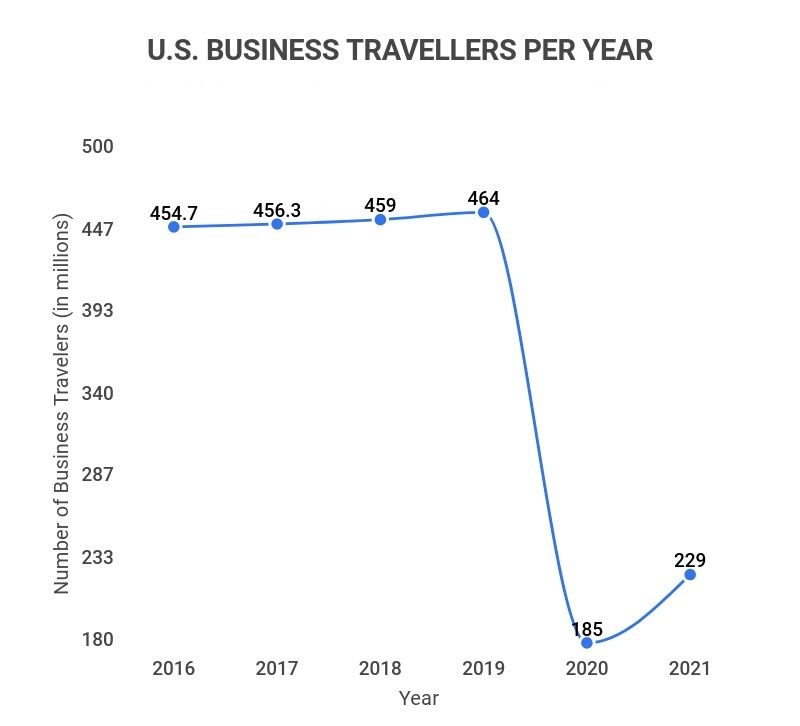
From 2019-2020, the number of business trips taken in the U.S. dropped from 464 million to 185 million.
-
The average business trip costs Americans $949 in travel fees.
For further analysis, we broke down the data in the following ways
Trip | Spending | Traveler | Company Policy | Trends and Projections

Mục Lục
General Business Travel Statistics
Knowing that business travel accounts for up to 75% of air travel revenue, it’s not hard to see why it’s encouraged. In fact, business travel is so lucrative that it even affects the U.S. GDP. Here are the facts:
-
In 2016 alone, business travel contributed $547 billion to the United States’ total GDP.
That’s around 3% of the total GDP, a number which stayed rather stable until 2020 when the COVID-19 pandemic negatively affected business travel. In reality, these high numbers might never return, as experts predict 36% less business travel post-COVID.
-
In 2021 business travel accounted for 13.6% of U.S. air travelers.
In 2021 there were approximately 229 million business travelers, which is a noticeable increase from 2020’s drop to 185 million. However, both years have had a relatively even share of business travelers (around 13%).
-
Business travel can account for up to 75% of an airline company’s revenue.
This trend can mostly be attributed to the booking of first-class tickets. Instead of saving money on business trips, more and more corporations are looking to provide their travelers with maximum comfort and convenience. While doing so makes the company look better, these decisions are mostly made due to competition.
-
Business travelers account for as much as 40% of hotel guests.
63% of these travelers are male, and 50% are between 35-54. Further, 56% of these individuals are employed in a professional or managerial position that earns them at least $127,000 per year.

Business Trip Statistics
Now that we know how profitable and common business trips are in the U.S., what does the average business trip look like? Well, according to our extensive research:
-
The average length of a domestic business trip in the U.S. is three days.
The average length for an international trip is 5-6 days. Overall, these numbers seem to slowly decline over time, with the old average (2016) for international business trips being just over six days.
-
Roughly 26% of business trips are only one day long.
This is another contributing factor for companies’ high cost of business trips, as same-day flights can wrack up costs. However, this does save the company money elsewhere (lodging, food, etc.).
-
38% of U.S. business travel is for meetings and events.
ME&I travel (meetings, events, and incentive travel) amounts to $139.3 billion of all business travel spending, nearly 42% of total business travel spending.
-
Roughly 1.3 million business trips are taken in the U.S. every day.
A number that took a hit from the 90% reduction in travelers in 2020. While these numbers may not recover to pre-COVID numbers, 2021 has increased.
Business Travel Spending Statistics

As shown, a good percentage of businesses invest in business travel despite the cost. However, you might be surprised to learn just how much business travel costs companies and employees. According to our extensive research:
-
The average three-day domestic trip costs between $990-$1,293.
While the average international trip costs an average of $2,600 or more. For this reason, business trips need to be especially valuable for the company or employee taking them.
-
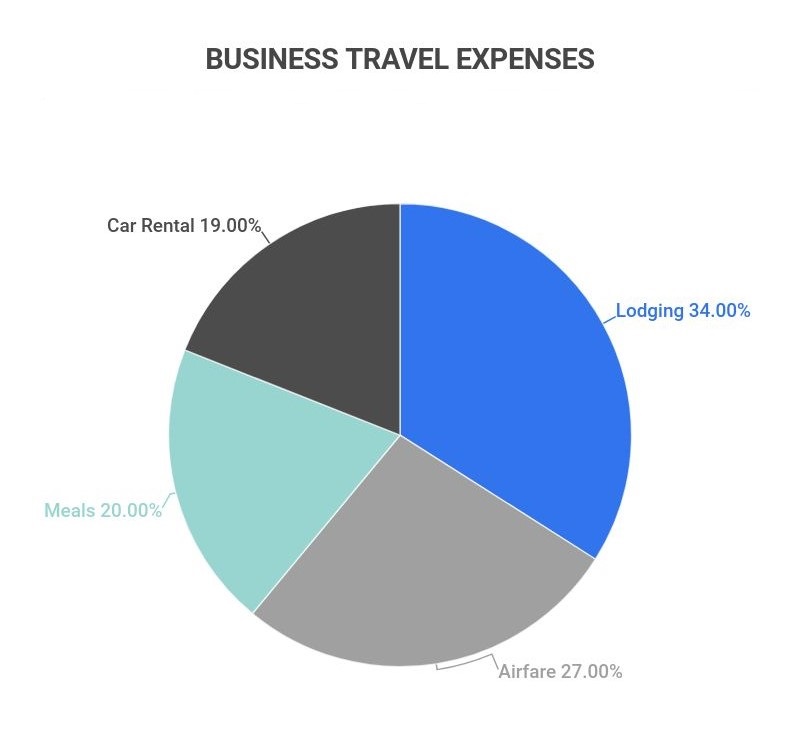
The average company spends 17-27% of its total travel budget on airfare.
You might be surprised to learn that airfare isn’t the most expensive part of business travel. Overall, the average domestic flight is $470, give or take how far away the destination is.
-
Over 20% of a typical business travel budget goes to food expenses.
That’s even more than flights and can amount to hundreds of dollars in expenses. One of the best ways to avoid this hefty cost is to utilize free hotel breakfasts. After all, never buying breakfast is a great way to cut food expenses.
-
The most expensive aspect of a business trip is lodging, making up around 34% of total costs.
Hotels make a lot of money from business travelers and the companies who sponsor their trips. This is especially true given the fact that up to 40% of hotel guests are business travelers.
-
Companies spend roughly $799 per person per day during a business trip.
That’s even more than flights and can amount to hundreds of dollars in expenses. One of the best ways to avoid this hefty cost is to utilize free hotel breakfasts. After all, never buying breakfast is a great way to cut food expenses.
Business Traveler Statistics
Because only 35% of companies actively partake in business travel, and it can be rather expensive, the demographics of travelers can be rather skewed. According to our research:
-
At least 50% of business travelers are between 35-54.
Undoubtedly, this abundance of higher ages relates to an employee’s position within the company. Older workers are more likely to have high-level positions. This can also be shown by the fact that 56% of business travelers hold professional or managerial positions that earn at least $127,000 per year.
-
The average business traveler takes roughly 6.8 trips per year.
And this number is even higher for millennials, who take an average of 7.4 trips per year. In that way, younger generations take more business trips on average (per person) than their older counterparts.
-
47% of female travelers are traveling on business.
While female business travelers are slightly less common than male travelers, women (on average) tend to enjoy their trips more than their male counterparts. Overall, 45% of women have positive experiences while traveling on business compared to 39% of men.
-
As of 2021, only 12% of corporate travel representatives feel as though their employees are unwilling to travel.
And with new CDC travel guidelines in 2021, 61% of employees now feel somewhat more comfortable traveling for business.
-
It takes an average of 38 minutes to complete and correct one expense report.
While it only takes 20 minutes (on average) to complete the expense report, at least 19% of expense reports have errors. Plus, with an average of 1.5 travel expense reports filed per month, that means employees can spend up to an hour filing them each month.
Business Travel Company Policy Statistics
Due to the potentially expensive nature of business travel, it’s no surprise that companies create business travel policies. Here are some stats related to business travel policies:
-
72% of corporate travel managers haven’t achieved their desired travel policy compliance level.
For the most part, this lack of compliance is due to shortfalls in the traveler’s experience, fairness and transparency, and not meeting budget requirements.
-
Only 50% of business travelers follow their company’s travel policy.
In fact, 60% of business travelers don’t even understand their company’s travel policy, making it especially difficult to follow.
-
81% of business travel is done via personal vehicle.
By contrast, only 16% of business travel is air travel. That means most business travelers travel to their destination by car.
-
90.6% of corporate travel managers agree that business travel is vital for company growth.
And this sentiment comes from a genuine place, as on average, businesses earn a $2.90 increase in profit for every dollar spent on corporate travel. That equates to an average $9.50 increase in revenue.
Business Travel Trends and Projections
The 2020 height of the COVID-19 pandemic took a major toll on business travel. While business travel has started to recover in 2021, the number of travelers is still around half of what it was pre-COVID. After extensive research, here are the facts about business travel trends:
-
From 2019-2020, the number of business travelers in the U.S. dropped from 464 million to only 185 million.
From 2010 to 2019, business travelers remained steady between 440 million and 465 million. However, this number dropped drastically in 2020 and has only increased to 229 million in 2021.
-
From 2010-2019, the number of business travelers grew by 4%.
However, the COVID-19 pandemic saw the number of business travelers decrease by 60%, which aligns with other travel declines caused in 2020.
-
The business travel industry is expected to experience a CAGR of 13.2% between 2021 to 2028.
Luckily, trends seem to show that business travel will start to recover from the COVID-19 pandemic over the next couple of years. Estimates predict that the value of the industry will increase from $695.9 billion in 2020 to $2.1 billion by 2028.
Business Travel FAQ
Conclusion
Business travel is an important investment for industries and companies all over the United States. That’s why, despite it costing them between $990-$1,293 per trip, they still choose to send employees on them. In fact, pre-COVID, at least 25% of U.S. travelers were business travelers.
These travelers tend to fall under certain demographics, with at least 50% of business travelers between the ages of 35-54 and 56% of business travelers holding professional or managerial positions that earn at least $127,000 per year.
However, COVID-19 took a heavy toll on the industry. The number of domestic business travelers dropped from 464 million to 185 million (25% to 13%). This job has affected airliners, hotels, the food industry, and more. Luckily, the business travel industry has a CAGR of 13.2% between 2021 and 2028, which indicates at least somewhat of a rebound.
Sources
How useful was this post?
Click on a star to rate it!
![]()
Author
Jack Flynn
Jack Flynn is a writer for Zippia. In his professional career he’s written over 100 research papers, articles and blog posts. Some of his most popular published works include his writing about economic terms and research into job classifications.
Jack received his BS from Hampshire College.


![Toni Kroos là ai? [ sự thật về tiểu sử đầy đủ Toni Kroos ]](https://evbn.org/wp-content/uploads/New-Project-6635-1671934592.jpg)


