25 Best Open Source & Free Network Monitoring Software Tools in 2023
Written By
As network engineers and administrators, we mostly focus on managing and configuring hardware devices such as routers, switches, firewalls, load balancers etc. We rarely deal with software management tools which are equally important in a corporate network.
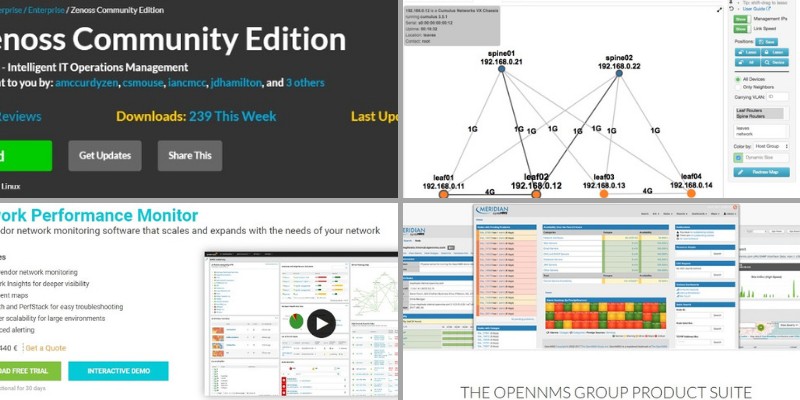
Without knowing the health, performance, availability and quality of your network is like running with closed eyes.
Network Monitoring Tools give you the visibility and knowledge in what is going on within your network infrastructure (including IT infrastructure such as servers, workstations, applications and Network infrastructure such as routers, switches etc).
There are many ways that network monitoring can help your business out. After all, being able to gauge the health of your servers, user workstations, computer applications etc is crucial to any business.
Being a critical IT process, network monitoring can help you to identify problems proactively at the initial stage thus preventing downtime and failures in the future.
Out of all the network monitoring tools out there, there are some that can easily break your budget. Thankfully, there are many open source and free options for you to look at, so that you can get the job done without spending money.
In this article I have researched the best open source and free network monitoring software which you can install in your network and start getting statistics, alarms and other useful information about your devices and infrastructure.
Let’s see them below. Note that the ranking is in no particular order.

Nagios is probably one of the most popular and well-known IT management and monitoring software.
There is a paid product called Nagios XI and also an open-source and free version called Nagios Core.
The latter runs natively on Linux and is currently used in thousands of implementations around the world as a free monitoring solution.
The Nagios Core application runs as a daemon and requires also an Apache/PHP (HTTP webserver) to be installed in order to facilitate the Web GUI interface of the tool.
Although it’s a very powerful tool that can monitor anything in a network, you need to invest a lot of time and have also very good knowledge of Linux command line in order to change configuration files etc. If you are an expert on these, Nagios Core is a great choice.
It can monitor the following hosts and applications:
- Network services such as HTTP, FTP, SSH, SNMP, SMTP, POP3, ICMP, NNTP.
- Host resources monitoring such as CPU load, memory, disk space etc.
- Monitoring of network devices such as routers, switches etc (packet loss, SNMP status, bandwidth monitor).
- Many other devices and applications can be monitored (either with agents or agentless).
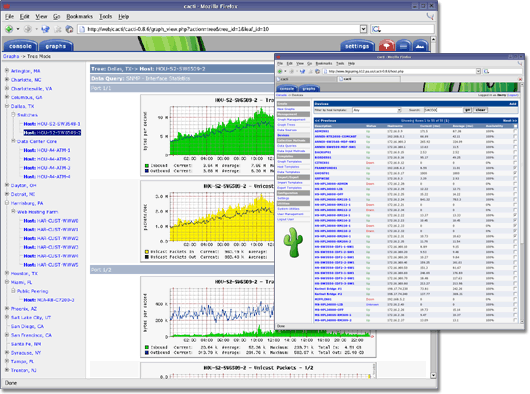
Cacti is a network graphing program that is designed to be fast, efficient, and effective. With it, you will be able to create a graph template and you will be able to use that to plot vast information, statistics, alarms, bandwidth usage etc for your network.
In general, this program is designed to store data about your servers, routers, switches, IT systems etc and present it to you in a functional graph that you can interact with.
Being a mature product with a very active community ensures that you will find help for any problem you will encounter with this application.
It works mostly with SNMP which is a protocol used by almost any networked device for management and monitoring purposes (SNMP=Simple Network Management Protocol).
If a device supports SNMP (almost all network devices and IT devices support SNMP) then Cacti can poll the device and create a graph for it such as performance, availability, statistics, network links bandwidth, faults etc.
Moreover, even if the device, equipment or system does not support SNMP but has some sort of API, then you can write collection scripts so that Cacti can graph almost anything.
It has a relatively hard learning curve since it requires the administrator of the tool to create pollers for data retrieval, storage and data presentation.
If you need to document and graph thousands of devices within your business, then Cacti is definitely a tool that you should be looking at.
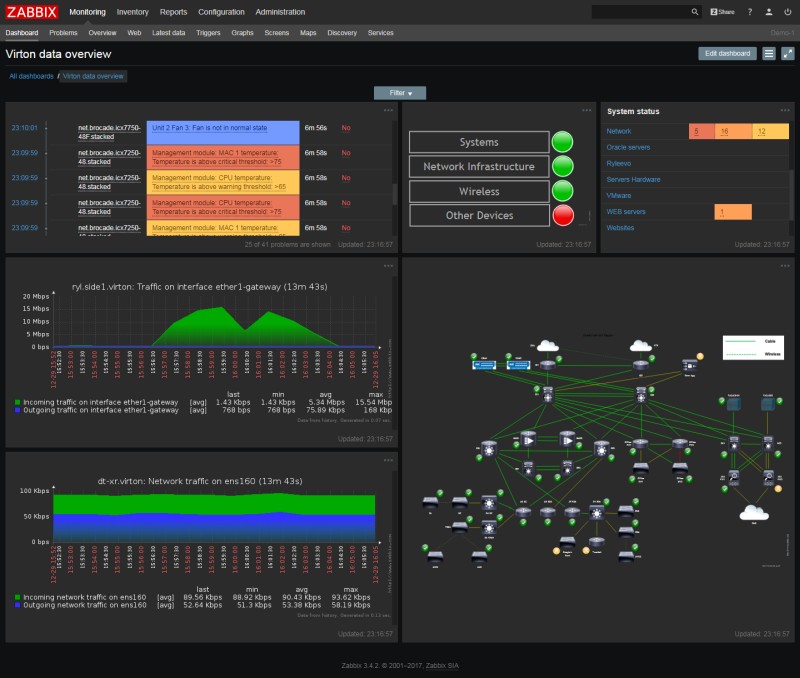
When most people are searching for a network monitoring tool, there’s a good chance that they are looking for a tool that is run by people who have a lot of experience working in this area.
If this is the case for you, then you will want to be looking at Zabbix. Zabbix is run by people who have 21 years of experience working in the network monitoring area.
With Zabbix you can monitor just about everything (just like Nagios), including network, servers, cloud, services running on systems and even application monitoring.
There are three components of Zabbix:
- Server
- Proxy
- Agent
The above can be installed on any Linux and *nix type of operating system, except Windows. Only the Agent component can be installed on Windows.
Zabbix offers a holistic approach on monitoring. It covers also performance monitoring of devices in addition to all other types of monitoring such as status, health etc.
It uses a centralized Web management system that allows for easy configuration compared to Nagios Core which depends a lot on text configuration files.
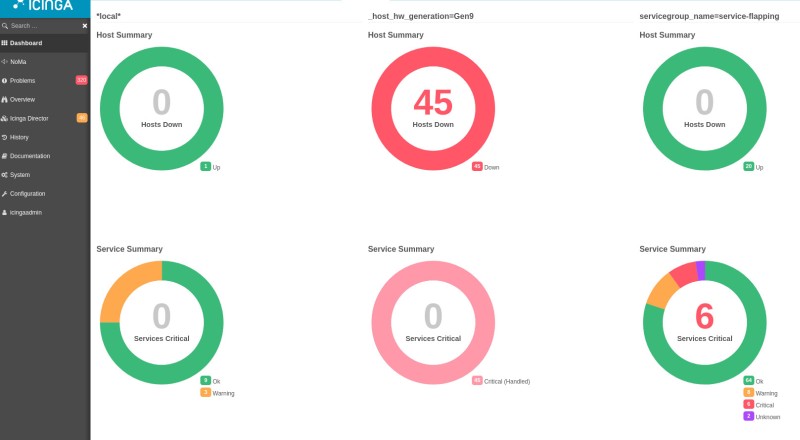
If you are still looking for a fast and efficient program that you can use to monitor your business’s network, you will also want to take a look at Icinga 2.
This is another open source program that is designed to check the availability of network resources, notify administrators of any outages, and it can also provide performance reports among other monitoring tasks. It is comparable to the popular Nagios.
No matter if you are working to handle a large-scale environment, or you need something that you can use to monitor your small LAN network, you won’t have to worry about a thing because Icinga 2 is scalable, and it can be used across multiple locations.
It is a fork of the Nagios tool we have described before and just like the previous monitoring solutions above it can run on the most popular Linux distributions such as Ubuntu, Debian, Red Hat, CentOS, Fedora, SUSE/SLES etc.
For complete installation you will need to install both the core Icinga 2 service and also the Icinga Web2 module (preferably using Apache and PHP-FPM).
Moreover, there are several agent modules (or check plugins) which are used to check and monitor external services and devices.
This software can monitor the following:
- User workstation Hosts, Servers etc
- Services running on machines
- Network devices (routers, switches etc)
- A variety of network services such as HTTP, SSH, SMTP etc.
- VMWare
- SAP
- Many more

Prometheus is usually run in a Docker container and can be consumed as a single statically-compiled binary with no other dependencies.
Although it’s a very powerful monitoring application, it has a steep learning curve and you need to have some software development skills to fully integrate the solution in your own systems and applications.
It is mainly used for system and service monitoring by collecting metrics from configured targets at given time intervals. It can then display the results and also trigger alerts if some conditions are met.
Since Prometheus uses a time-series database to load data from targets, some people are using this open source solution to collect data about network link bandwidth (over time) from routers etc. That’s just one of the use cases in a network environment.
With an SNMP exporter, you can also walk and poll data from almost any networked device or IT system that supports SNMP.
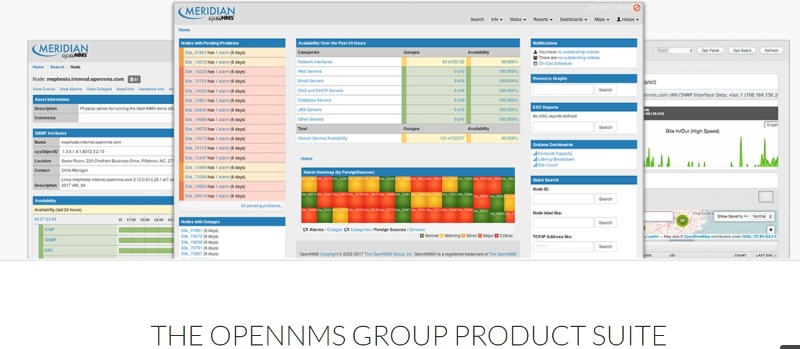
OpenNMS is supported by “The OpenNMS Group“ which provides consulting and support services to customers who would like to integrate the solution in their network. As a software, OpenNMS is of course free to download and use.
One of the differences with the previous tools in this article is that OpenNMS runs also on Windows (in addition of course to any flavor of Linux which is the preferred OS).
The vendor calls this tool “carrier-grade and highly integrated” software and this is true. It’s a very powerful monitoring application and if there’s something you need monitored and reported, OpenNMS can do the job.
However, its customization strength is also a weakness. It has a very steep learning curve and you need to have capable and knowledgeable administrators to fully utilize its powerful features.
Open source network monitoring tools are one of the best things for companies that can handle working and integrating such programs into their systems. As long as you have employees who know how to integrate OpenNMS into your business, you can rest assured knowing that you will be able to monitor almost anything.
In a nutshell, OpenNMS can replace expensive commercial software but you need to have capable admins to handle its complexity.
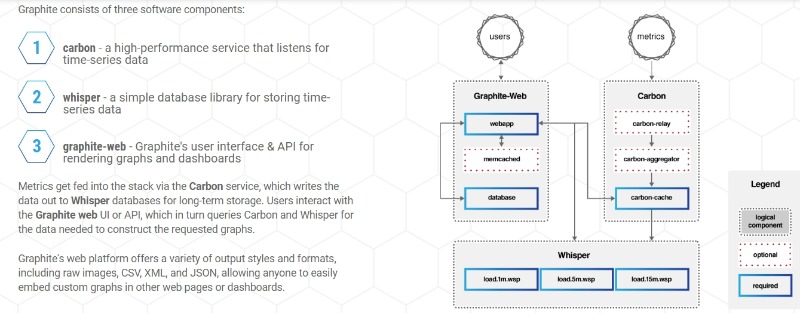
Graphite is an open-source tool used to store and graph time series data, just like Prometheus we have described before.
This tool is used by massive companies, such as Lyft, Etsy, Booking, and even Reddit. It can be used to track the performance of networked servers, websites, applications, business services and many more.
In general, Graphite lives up to its reputation of being reliable, efficient, and effective when it comes to storing, retrieving, sharing and displaying time-series data.
Data collection is done by a third-party component called “Carbon” which passively listens for time-series data. This means that external applications and systems must be configured to send data to Carbon which will be used by Graphite for storage and rendering.
While most of the programs on this list are either free or open source, there are a few programs that are not free but they include a Free Trial.
This doesn’t mean that you should ignore them. In fact, you should keep an eye on the offers of these programs. For instance, many of them will offer a free trial where you can dip your toes into their take on network monitoring.
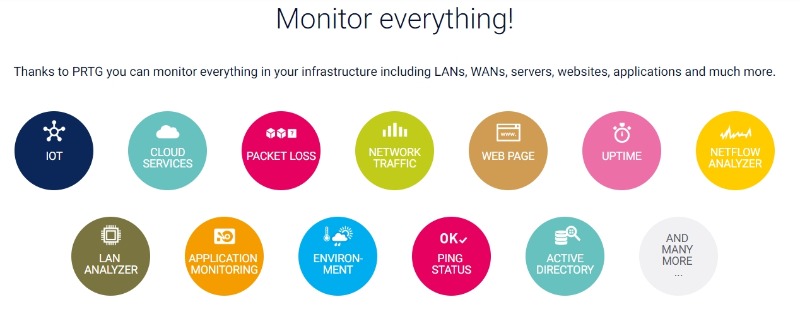
Paessler PRTG is a program that has just about everything you could ever want when you are looking for a network monitoring and management solution.
It offers compatibility with a huge number of devices, meaning that you can see how the health of your network is faring no matter what type or models of devices you have installed.
The Free edition supports up to 100 sensors which is more than enough to evaluate its capabilities. For more than 100 sensors, there is a 30-day free trial before buying.
Speaking of sensors, PRTG allows you to perform network bandwidth monitoring via sensors for Packet Sniffer, Cisco ASA VPN, sFlow, Windows network cards, and more.
It can monitor the following types of devices and systems:
- All network devices (wireless access points, routers, switches, firewalls etc).
- Software applications
- Cloud based applications
- Servers
- Storage
- Workstations
- Services running on machines
- And much more
If you don’t mind spending some money for a serious monitoring solution, then the paid version of PRTG is an excellent choice for any type of network and IT infrastructure.

This is a great free Network Management System software with many happy users. People use LibreNMS to manage and monitor Cisco devices, Juniper, Brocade, Foundry, HP, Pfsense, Linux boxes, telecommunication systems, almost any network device vendors etc.
Some of the metrics that can be monitored include network bandwidth per interface, CPU usage, up/down interfaces and much more.
One of the features I like is the automatic discovery of your network. It can use CDP, FDP, LLDP, OSPF, BGP, SNMP and ARP as protocols to discover any devices in your network.
The application is based on Apache, PHP, MariaDB and can be installed on Linux systems. It uses primarily SNMP to poll and access networked devices and IT systems. This is the protocol used by most legacy and modern NMS systems for decades, so its no exception for LibreNMS.
Its alerting mechanism can send you SMS, Email, slack etc so as an administrator you have many options to get notified about network problems etc.
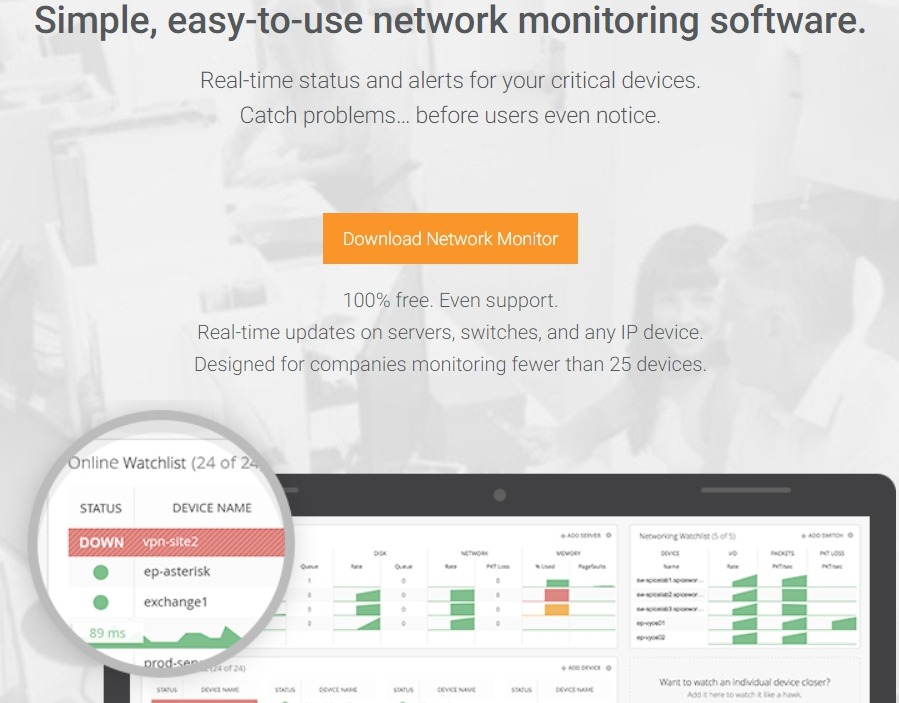
Being able to monitor things in real time in your IT infrastructure and network is always crucial. Especially when it comes to problems in your networking, where a single problem can mean that your entire business can be down for a few hours or more.
Because of this, if you want to make sure that you are well aware of problems before any of your users even notice them, you will want to see what Spiceworks Network Monitor can do for you and your business.
Basically any server, switch, network device and anything with an IP address (that supports SNMP) can be monitored in real-time with this tool without having to buy an expensive software solution.
The Spiceworks monitor tool can be installed on Windows servers (2008 R2 and later) and after crating a free Spiceworks account you can log into the monitoring system and start using the dashboard.
EDIT: Right now Spiceworks tool supports also installation to Linux systems such as Ubuntu, Redhat, Fedora, Debian etc.
The following can be monitored by Spiceworks software (among many other things)
- Switches, routers and all network devices with SNMP (packets/second, input/output rate, packet loss etc).
- Windows machines (e.g Win 7, 10, Servers etc). You can track CPU, hard disk space, network data rate, packets etc.
- Ping check to verify if devices are alive (e.g VoIP phones, security cameras and anything with an IP address).
11. Solarwinds Network Performance Monitor – Free Trial
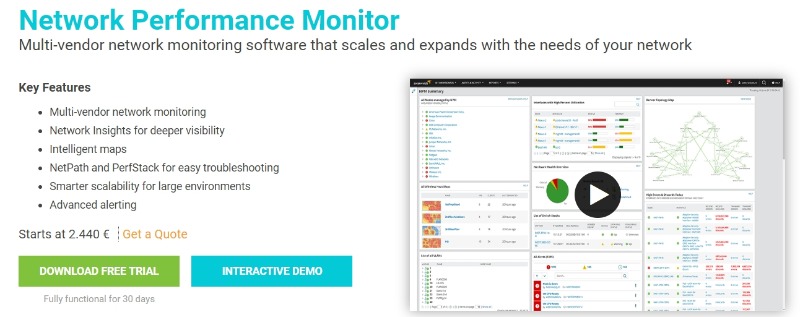
This is another program that is actually commercial but offers a free trial for you to see what slice of network monitoring it has to offer.
Thankfully, the free trial doesn’t put any restrictions on what you can do, which means that you will be able to get a solid feeling of how the program works before you make the investment.
This program specializes in providing all the information you need to know in an easy to read display, so that you can stay on top of your network monitoring, preventing problems before they become detrimental for your business.
If you are an SMB company with limited resources and time to monitor your network and IT infrastructure, then I suggest to invest the money and get the paid version of Solarwinds. Being one of the most sophisticated products in the market, it will surely offer you a complete and hassle-free solution.
The tool can be installed on Windows Servers and by providing it your range of IP addresses it will Autodiscover all of the devices that are SNMP or WMI enabled.
It supports also monitoring of more than 1500 apps including also Cloud based servers by using Windows or Linux agents on your Amazon AWS or Azure clouds.
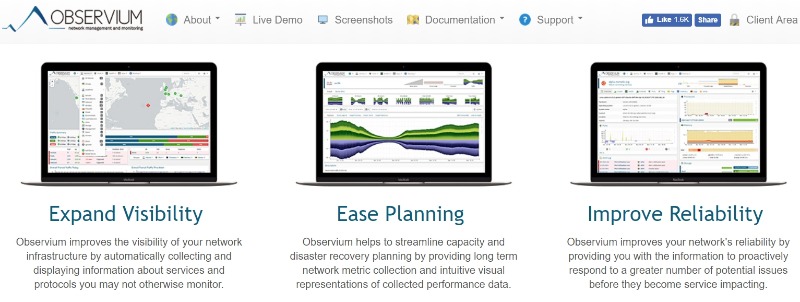
Somewhere between a free trial version, being completely free and open source, and purchasing a full priced product comes the community edition of some products.
Generally, as the name might suggest, community editions are usually free as well, but you have to rely on the product’s community for support. Moreover, the community edition of Observium has limited features compared to Enterprise and Professional versions.
If you are running a smaller company, but you still want to make sure that your networking is going okay, then you will want to keep an eye on the community edition of Observium, which offers many of the features and characteristics that you would want with most network monitoring programs.
The commercial edition is used by many large organizations such as US Department of Energy, Paypal, Ebay, Twitter etc.
Observium can be installed only on Linux systems but can easily monitor Windows machines as well plus many other devices and systems such as over 458 different Operating System types, traditional networking equipment (including routers, switches etc), Security and Network Control devices, Wireless devices and much more.
On the Linux system to be installed, you must also install Apache and MySQL as prerequisites.

Another community edition of a network monitoring tool is Zenoss Community Edition. This tool makes it very clear that it is neither a demo nor a trial version of its larger products, but rather a smaller version of them, modified to be better suited to smaller systems.
If you are still looking at community editions of network monitoring tools, then Zenoss is another one to consider. Choosing to put your time into such a tool can better your business significantly in the long run.
Compared to its commercial siblings (cloud or on-premise), the community edition has a limit of 500 nodes monitored.
Compared to other open-source or free NMS solutions, Zenoss requires lots of RAM (32GB and more) for a single host installation.
It offers autodiscovery (along with manual addition of monitored devices) and does not use agents. Instead it relies on well-known management protocols such as SNMP, SSH and WMI together with other protocols such as POP3, FTP, HTTP etc.
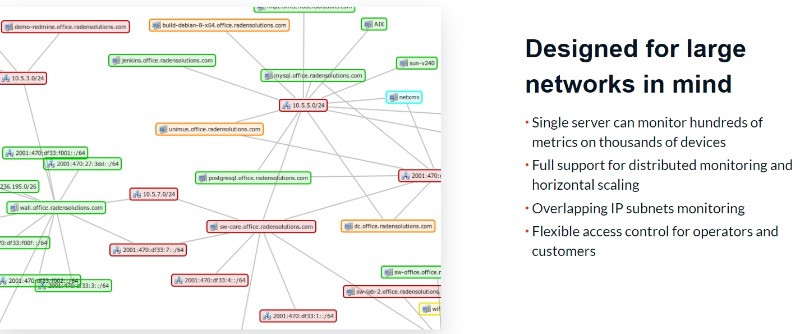
Being able to work from multiple platforms and being able to customize just about any and every feature you come across is still something that many people look for in their network monitoring tools.
Thankfully, NetXMS is a program that offers these features for you and your business. No matter if you are looking for a tool that you can easily scale with the size of your business, or you are looking for a tool that can be integrated with other third-party tools, this is going to be one that you should keep an eye on.
The software can be installed on Windows, Linux and several UNIX versions. It supports also the most popular databases such as MySQL, Microsoft SQL, and PostgreSQL.
I like its in-depth network visualization and monitoring capabilities such as Automatic Layer 2 and Layer 3 discovery, Active discovery with scanning probes, passive discovery based on ARP and routing tables of routers, SNMPv3 support etc.
Another community edition of a network monitoring tool that you should keep an eye on is the PandoraFMS tool.
However, there is one difference between this one and the others. PandoraFMS is still open source. What this means is that with enough time and dedication, you and your company might be able to build on the foundation of this tool, making it suitable for large companies.
In a way, if you choose to get PandoraFMS while your business is still young and learning, it could potentially grow with your business. Aside from this, it can perform many of the functions that other commercial network monitoring tools can.
Here is what you can monitor:
- Any network device (routers, switches etc)
- Windows machines
- Linux/UNIX machines
- Virtual infrastructure
- All different kinds of applications
- much more
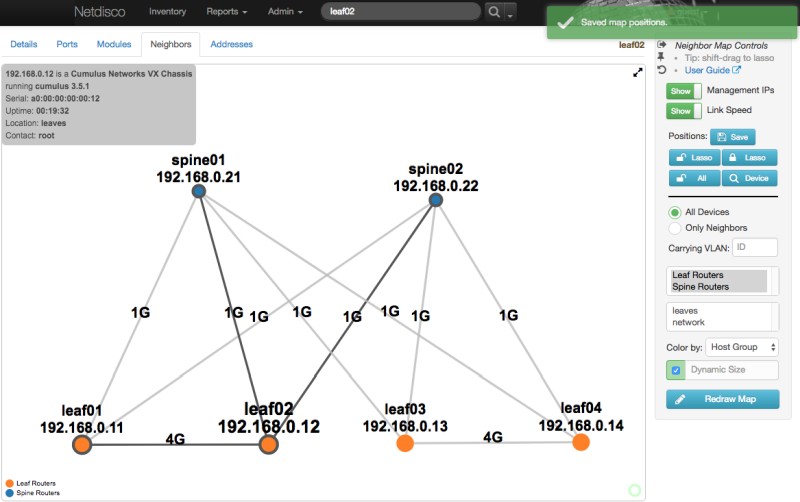
Sometimes, it is interesting to see where network monitoring tools come from, as it can inspire you to consider their services.
NetDisco is a “web-based network management tool” that anyone from small to enormous networks can benefit from. This program was written in Perl and is very easy to install on Linux and Unix systems.
It prides itself as being lightweight with IP and MAC address data collected in its database using SNMP or other means.
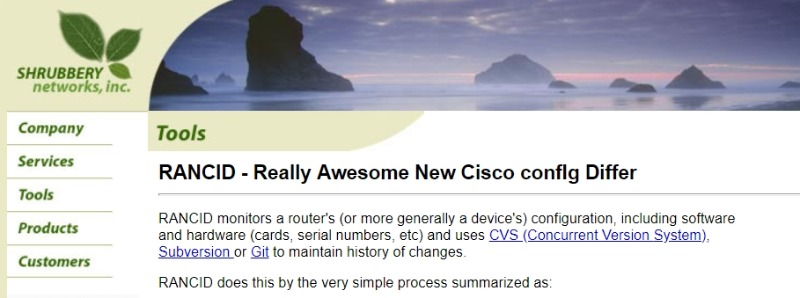
If you are looking for a way to monitor configurations and change management of devices, then RANCID might be able to help you.
Unlike the other tools in this article, this software is focused mainly on configuration management, to track software and hardware configuration changes and to maintain a complete history of them.
RANCID, which stands for “Really Awesome New Cisco ConfIg Differ,” is designed to manage configuration of gear not only from Cisco but from other vendors such as Juniper. It uses a revision control system (i.e. CVS or Subversion) repository to achieve the above.
From cards, to serial numbers, and just about everything else including a history of changes, RANCID will keep an eye on just about anything that goes on in your networking configuration.
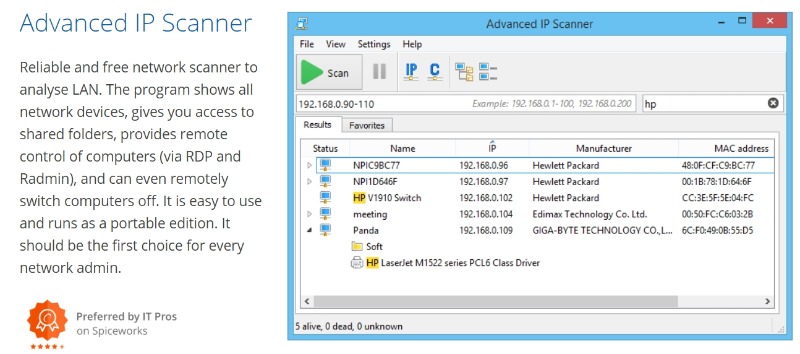
Last but not least, there is the Advanced IP Scanner. As the name of the software suggests, this program’s main function is to scan the IP addresses of all network devices in your LAN in order to map and identify all connected hosts and nodes.
In addition to IP scanning, it can also provide remote access to machines (using RDP or Radmin), give you access to shared folders and even switch computers on/off over the network.
The program itself is small and easy for anyone to use, meaning that if you want to be able to keep a close eye on what the health of your network is, just as 40 million other people are doing, then you should look at Advanced IP Scanner.
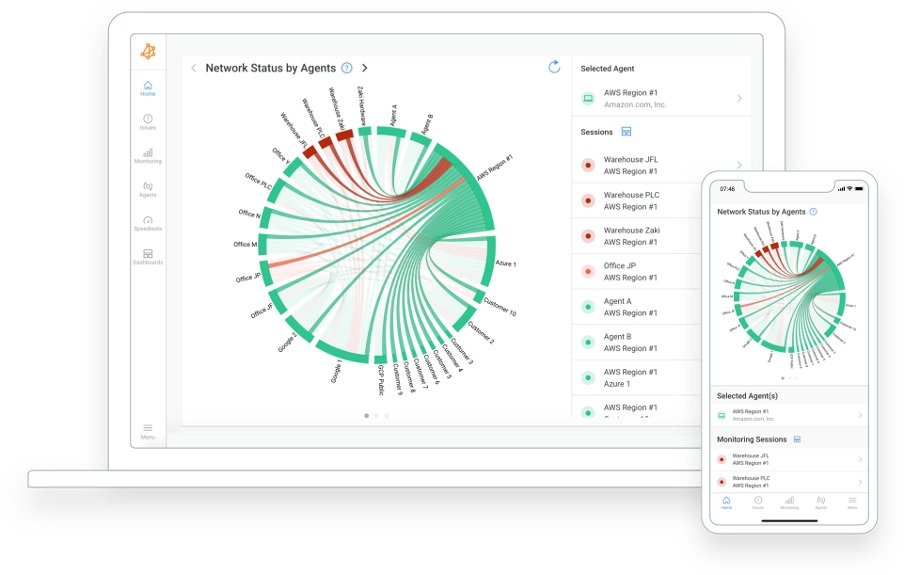
Obkio is a simple network performance monitoring SaaS solution that empowers users to take control of their network performance.
Continuously monitor the health of network and core business applications to improve the end-user experience and identify the cause of intermittent network, VoIP, video, and applications slowdown in seconds – because nothing is more frustrating than a faulty connection.
Obkio’s solution consists of deploying physical or software network monitoring Agents at strategic locations in a company’s offices or network destinations to continuously measure network performance, collect data, and notify users of network issues or degradation.
Obkio continuously tests and measures different operating parameters based on network metrics, such as latency, jitter, packet loss, quality of service and customer experience via the QoE (Quality of Experience) and performs speed tests regularly to check whether the data available coincides well with what should be offered by service providers.
With Obkio’s Network Device Monitoring solution, monitor the performance of key devices such as Firewalls, Routers, Switches, Wifi APs and any SNMP-enabled devices.
Try Obkio for free with a 14-day trial, with access to all of Obkio’s premium features. Users can also choose from a variety of free and paid plans tailored to their needs.
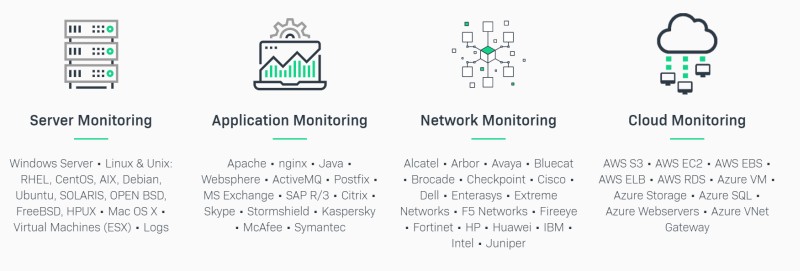
This is another networking and infrastructure monitoring option that has both a free open source edition (Raw Version) and a paid Enterprise edition.
Regarding network monitoring, the tool supports some of the most popular vendors such as Cisco, Fortinet, Checkpoint, Juniper, Huawei, F5 networks etc.
In addition to network monitoring, it can also monitor applications, servers, cloud infrastructure (AWS, Asure etc), storage, databases etc.
The commercial Enterprise Edition costs around $800 per year for 100 hosts and the price goes up according to the number of hosts (e.g for approximately 400 hosts the price reaches around $2800 per year which is a pretty good price for an enterprise software of this caliber).
Bandwidth Usage Monitoring Tools
The following section will showcase some free tools that are mostly focused on bandwidth usage monitoring in networks.
These types of monitoring software are essential in getting an overall picture and visibility into network usage.
Moreover, these tools can help in identifying high-traffic hosts/users, probable abusive behavior, possible security infections (hosts that generate a lot of traffic can be members of botnets) etc.
A bandwidth monitoring tool can also help in capacity planning. If your company’s Internet broadband link is 100Mbps and you see that is over 80-90% utilized, it is a sign of subscribing to a higher speed plan from the ISP.
There are both Network-based and Host-based tools in the list below that can give you as a professional a useful insight into what “eats-up” your network bandwidth.

Solarwinds is another vendor that goes head-to-head with Paessler in offering professional and cutting-edge software tools for network management and monitoring.
Solarwinds Free Real-Time Bandwidth monitor is not as functional and scalable as PRTG, but it is a better choice for less demanding use cases. Not only that, but since it’s free, you could get it for personal use.
This free option performs interface bandwidth polling and delivers visual performance reports. It uses SNMP to poll the bandwidth usage from device interfaces, which means that you must have SNMP enabled and configured (almost all network equipment support SNMP).
For more functionality, you may also get yourself the paid Network Performance Monitor with more detailed reports, network mapping, alerts, hop-by-hop network analysis, and some other extra useful features.
The paid software package starts cheaper than PRTG – from $1,290 euros – and has a 30-day free trial. There are several pricing plans, but Solarwinds doesn’t provide much information on them – you’ll have to get in touch with the sales team for more details.
ntopng is the direct successor of the original ntop. The key feature of the new ntopng is its cross-platform compatibility – it has been written portable and can run on Windows, macOS , and every Unix system.
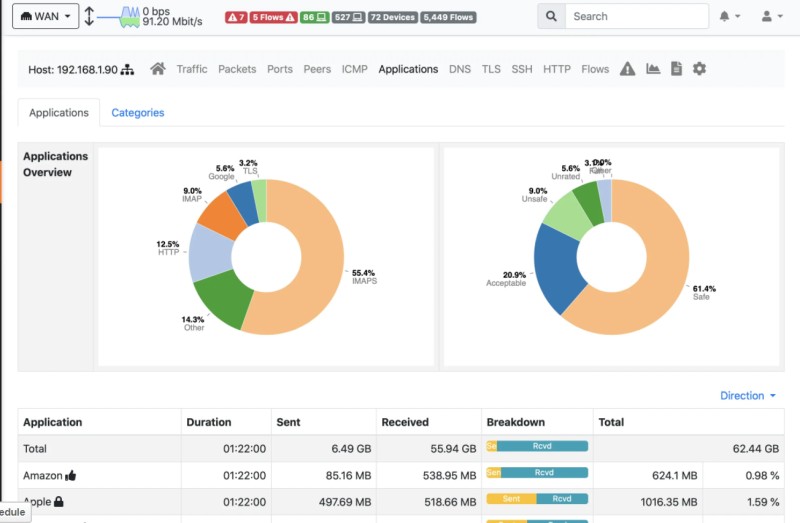
With that said, Unix would be the best environment for this app since some of its features aren’t available elsewhere.
ntopng has four plans and allows you to monitor from 32 to 128 different interfaces – excellent for larger companies.
And to make network monitoring easier, ntopng can generate visual reports and identify specific application protocols, like Facebook or BitTorrent.
Basically you will need to install “ntopng” on the host to monitor (Linux, Mac, Windows) which will collect traffic from the NIC (network interface card). The tool does not monitor only traffic but also disk space, load, netflow etc.
BitMeter OS is open-source and completely free, so it is accessible to anyone. You may use this software on Windows, Linux, and macOS devices as well, so this is another host-based tool (in contrary to most of the tools discussed in this article which are network-based).
Needless to say, a free piece of software won’t provide much network bandwidth functionality, but it’s just enough for basic monitoring.
BitMeter OS offers convenient charts for bandwidth analysis in real time, and it can also accumulate historical data to let you identify trends in data usage.
You may additionally set up alerts that would notify you when your data usage exceeds some threshold value specified by you.
NetWorx is intended for not too demanding users – its licenses start from a mere $25, although there is the Site license with a $1,000 price tag. There is also a 30-day free trial that allows you to give all features of NetWorx a try.
NetWorx Home and Business plans allow you to monitor network bandwidth from 5 to 10 devices, while the Site license can track an unlimited number of devices within the same organization.
In terms of features, NetWorx is pretty nice. Aside from providing graphical reports, it supports Wi-Fi cards, ADSL, and cable modems, can automatically disconnect from the network if data usage exceeds set limits, and has a speed meter for internet testing.
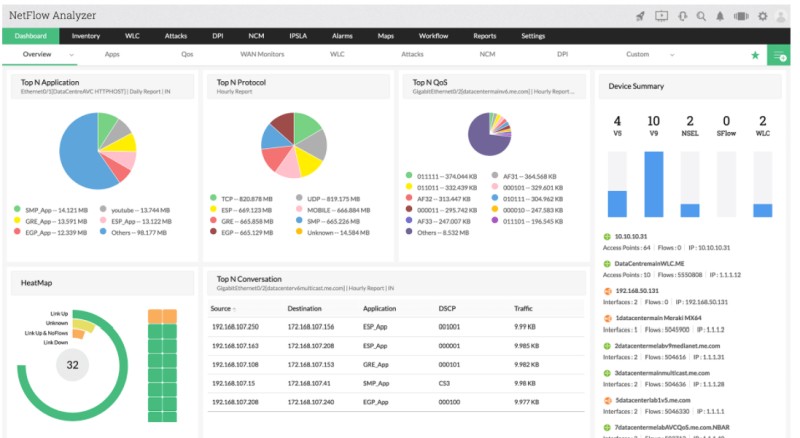
ManageEngine is also a well-known vendor that develops fairly-priced software in the area of IT and Networking.
If you use the product for personal use, then there is a free edition that can monitor up to 2 interfaces.
A notable feature of NetFlow Analyzer is that it can monitor distributed networks, which is great for cloud-based workflows. Aside from that, you are getting tailored performance reports for Cisco AVC and WAAS along with a few other goodies.
As the name suggests, the ManageEngine option works using NetFlow technology. This means that you must enable and configure Netflow (or other flavors such as sFlow, J-Flow, IPFIX etc) on your network equipment (switches, routers etc) in ordet to send Netflow traffic to collectors for monitoring.





![Toni Kroos là ai? [ sự thật về tiểu sử đầy đủ Toni Kroos ]](https://evbn.org/wp-content/uploads/New-Project-6635-1671934592.jpg)


