20 Best Network Mapping, Diagram & Topology Tools 2023 (Paid & Free)

Having a good network diagram gives you a bird’s eye view of what’s going on which is great for troubleshooting problems, planning ahead, and staying on top of network changes.
Many network performance monitoring software include some level of network mapping, drawing or diagram functionality that usually includes autodiscovery of the devices connected to the network.
The tools on offer range from rudimentary maps that are backed by automatically-collected inventories to sophisticated topology graphics tools that do not have any autodiscovery capabilities.
Mục Lục
Here is our list of the best network mapping and topology software:
The best network mapping software
Our methodology for selecting network mapping and topology software
We reviewed the network mapping and topology software market and analyzed the options based on the following criteria:
- Automated device discovery for topology mapping data sources
- A live redrawing of the map to account for recent layout changes
- A choice of views, such as all devices or just Layer 2
- The ability to integrate with live device status data
- A system that can map wireless networks and WANs as well as LANs
- A free trial or money-back guarantee for no-risk assessment
- A price that offers a good deal for the amount of services provided
The following tools will improve your documentation and presentation. Improved presentation enhances the network administrators’ ability to communicate with non-technical stakeholders in your organization and help you win the right budget for the network creation project.
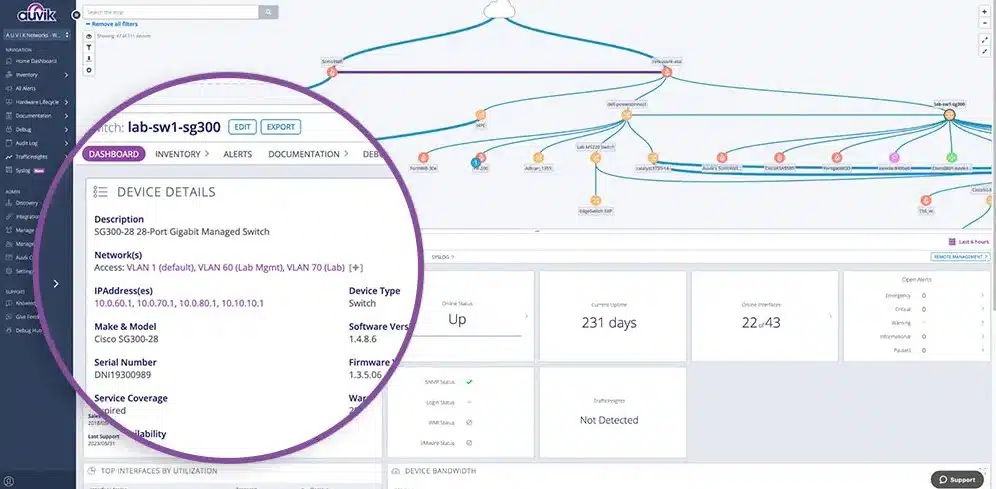
Auvik is a SaaS platform that implements network monitoring and asset management functions through the use of an on-site agent. The central detection service of this package is its network discovery system, which also creates a network asset inventory and draws up a network map.
Key Features:
- SaaS platform
- Creates asset inventory
- Constantly updated
- Automatic configuration backup
Why do we recommend it?
Auvik will discover all of the devices connected to a network, log them in an inventory, and then map the network. This tool re-checks the network periodically and keeps the network inventory and map constantly up to date.
The Auvik network map has a distinctive style. It isn’t a topographical map, so it couldn’t be laid over a world map or an office layout. Instead, it uses a tree structure that identifies the links between network nodes. This is particularly useful if you want to get a switch port summary of one device because you can get a view showing all the ports on the device that are in use, together with a note on the destination of the cable plugged into each of them
The network map gives access to details on each device. These are Layer 2 and Layer 3 systems and you can get details on their addresses, manufacturer, model, and operating capacity. The full Auvik console headlines major issues, which are derived from alerts that identify performance problems or device faults.
The Auvik tool enables you to manage network devices and that includes the standardization and protection of device settings. The service will backup configurations, keep a version library, and enable rollback to any specific point in time. The Auvik system monitor rescans every device every 60 minutes to check on configuration changes. If an unauthorized change is detected, the service restores the stored, standard configuration.
There are two plan levels with the Auvik package: Essentials and Performance. The Essentials service offers network device status reports. The Performance deal gives you bandwidth analysis with live capacity reports that can be viewed in the details of each device.
Who is it recommended for?
Auvik is an automated network monitoring and management system. Not only does it map the network, but it will raise an alert if a device is experiencing problems and it will also protect the configurations of network devices. This is a good tool for overworked network managers who just don’t seem to have the time to get anything done.
Pros:
- Network traffic analysis
- Automatic network discovery that is constantly updated
- A network device inventory
- Network mapping for Layer 2 and Layer 3 devices
- Switch port mapping
Cons:
- No on-site version
Auvik doesn’t publish its price list. The exact price depends on which plan is chosen and the size of the network that is to be monitored. You can examine Auvik on a 14-day free trial.
EDITOR’S CHOICE
Auvik is our top pick for network mapping, diagram, and topology software because it adds system monitoring and security protection to network discovery and topology mapping. Get physical, Layer 2, and Layer 3 maps of your network that show device connections and traffic patterns on each link. Discover the network load per application and implement traffic shaping measures to improve the delivery of time-critical applications. The service also prevents unauthorized tampering with network device configurations.
Download: Access 14-day FREE Trial
Official Site: https://www.auvik.com/lp/see-auvik/
OS: Cloud-based
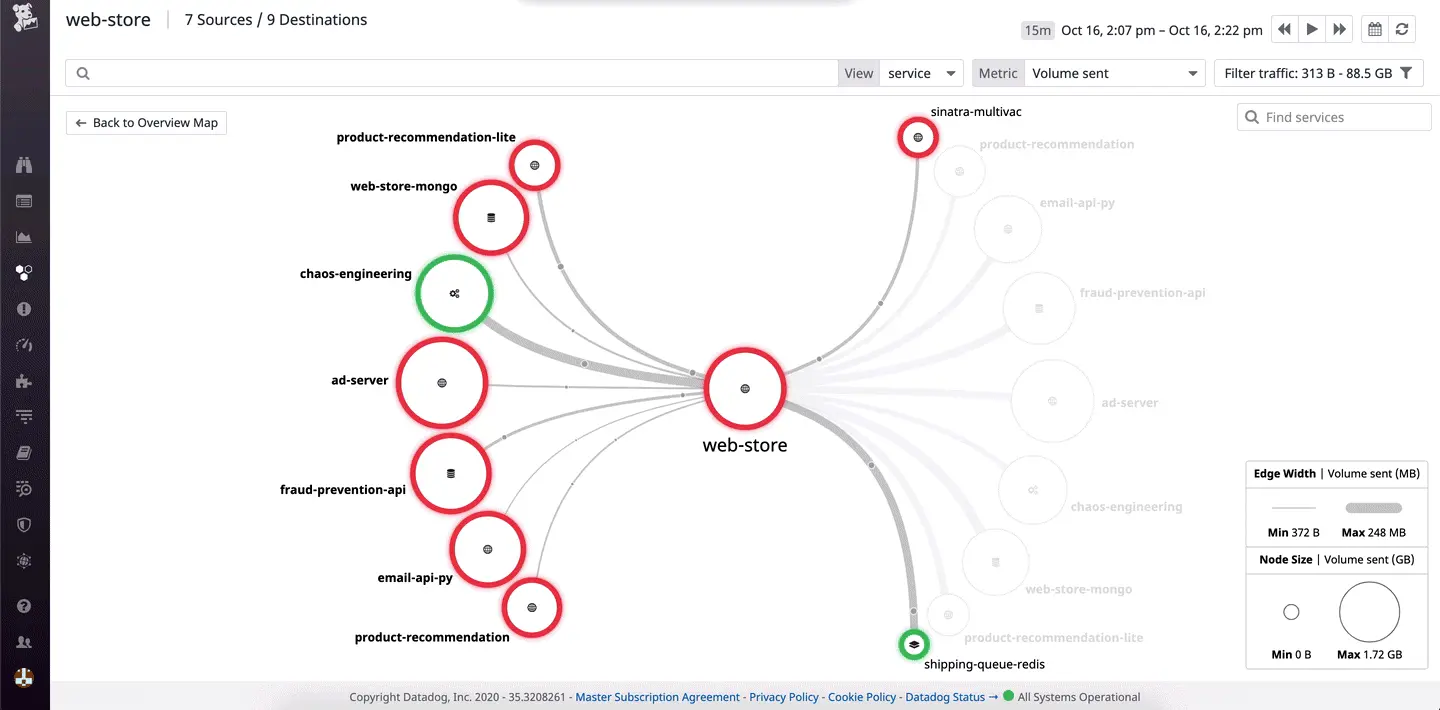
Datadog includes live network mapping services in its two network monitoring packages. These plans are the Network Performance Monitor, which provides network data flow analysis, and the Network Device Monitor, which provides constant checks on switches, routers, and network appliances. Both of these services are delivered from a cloud platform.
Key Features:
- Network autodiscovery and visualization
- Tagging and filters enhance search capabilities
- Live mapping and traffic patterns
Why do we recommend it?
Datadog is a cloud platform that offers many system monitoring and management tools and the Live Network Mapping system is part of a module called the Network Performance Monitoring package. This is a traffic management service and it will map your network, showing live traffic flows on each stretch.
The Live Network Mapping system is able to cover local, remote, and cloud-based systems, even monitoring traffic flows on the internet connections between locations. The service automatically draws up a network map. Once assessed, the network topology view can be altered on demand to show the connections to a specific device, a topology plan of the whole network, or a focused layout of a specific route between two endpoints.
The plan constantly checks on the nodes available on the network and will automatically redraw the network topology map if any devices are added, moved, or removed. The visualization of the network also shows a live report of the traffic flow throughput on each link.
Who is it recommended for?
When compared to Auvik, this service doesn’t quite compete because the Auvik plan gives you network device status checks. You have to add on another module to the Datadog Network Performance Monitoring system, which is called Network Device Monitoring. With these two modules, any network manager can leave network monitoring to the Datadog system.
Pros:
- Has one of the best interfaces for network mapping
- Uses live network mapping to pull in new devices, and reflects changes in the network right away
- Features data flow analysis to help administrators understand dependencies as well as performance metrics between devices
- Subscription model makes DataDog accessible to any size business
Cons:
- Would like to see a longer 30 day trial period
Datadog’s monitoring systems are charged for by subscription with a rate per month or at a lower rate if paid annually. Both the Network Performance Monitor and the Network Device Monitor include live network mapping and you can get both of these plans on a 14-day free trial.
Datadog Live Network Mapping
Start 14-day FREE Trial
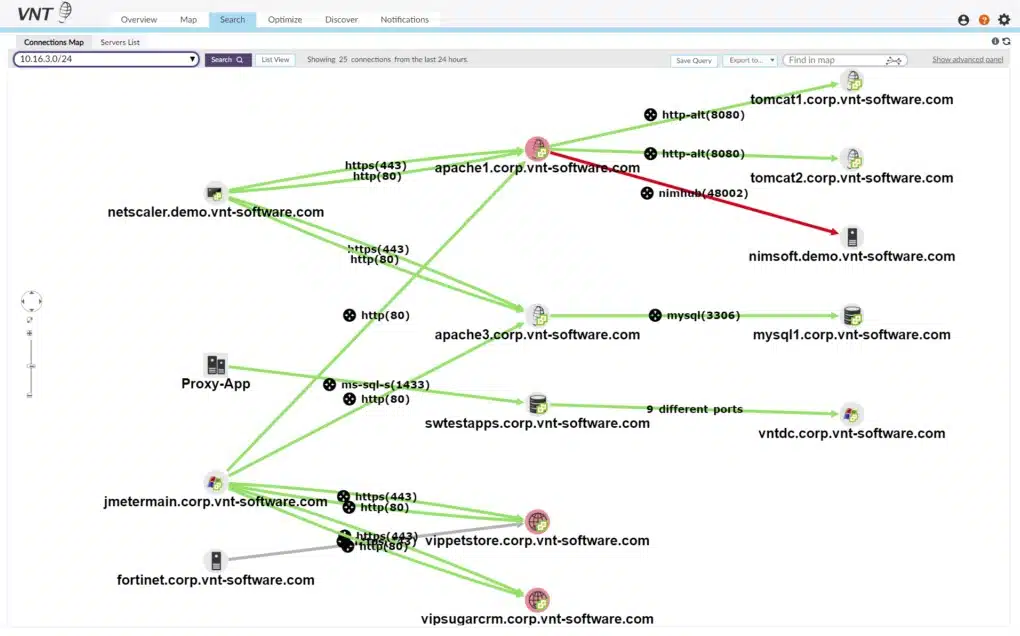
Faddom is a hybrid system documentation and mapping package that is able to identify resources both on premise and in the cloud. The service provides IT asset inventories and network maps.
Key Features:
- Automated network discovery
- Constantly updated
- Network topology mapping
Why do we recommend it?
Faddom is a hybrid IT asset inventory mapping system. It documents your network and all connected devices. That creates an inventory and the Faddom tool generates a map from that list so you’ve got your hardware and software inventories in place. The system is also able to trace through running processes and create an application dependency map.
The Faddom tool provides hardware and software inventories that can be used for system mapping.
The searching and mapping capabilities of Faddom can be applied to application dependency mapping. This use identifies all of the supporting microservices that back the frameworks, APIs and plug-ins that supply many of the functions that get folded into mobile apps and websites.
Who is it recommended for?
Faddom is an inventory system and it isn’t intended for system monitoring. So, like SolarWinds Topology Mapper, the buyer of this tool would be someone who is happy with an existing network monitor except for the maps that it provides.
Pros:
- A discovery and mapping service for networks
- A constantly repeating system that updates assert inventories and topology maps
- Software inventory for patch management and software license management
Cons:
- No cloud version
Faddom is a downloadable, self-service virtual appliance that can be run on an on-premises or cloud server. You can get a free trial of Faddom.
Faddom
Start FREE Trial
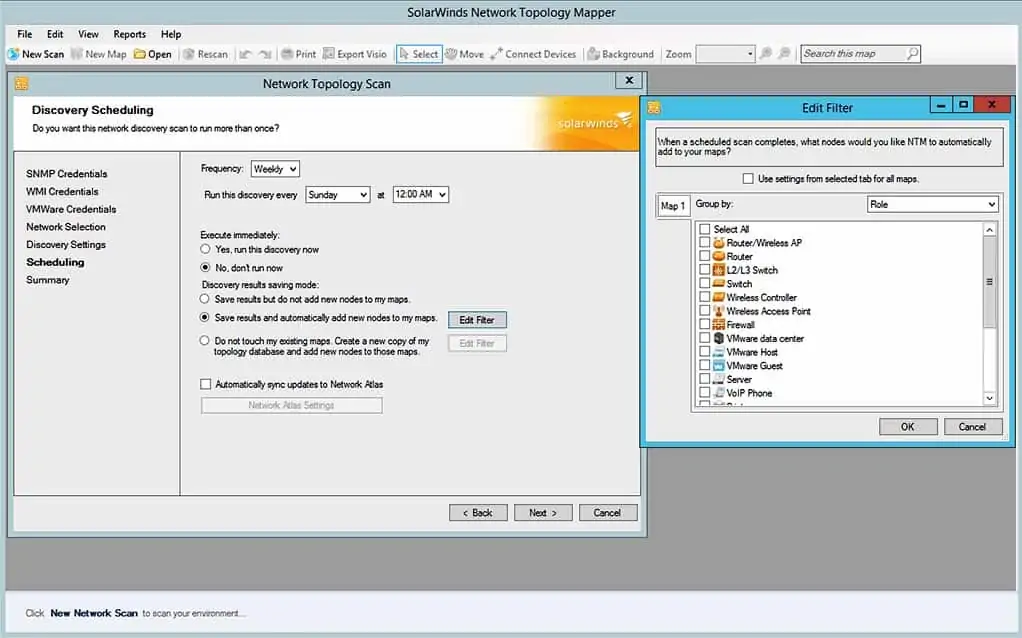
The SolarWinds Network Topology Mapper includes on-demand device discovery and automated mapping. This gives you a great starting point if you are adding to an existing network. You can choose whether the discovery procedure uses SNMP or ICMP (Ping and Traceroute) to locate devices. It can also identify network infrastructure through WMI and CDP (Cisco Discovery Protocol) methods.
Key Features:
- Network autodiscovery
- Customizable topology maps
- Maps Hyper-V and VMWare virtualizations
- Icon selection for different devices
Why do we recommend it?
The SolarWinds Network Topology Mapper automatically scans a network and provides a range of network maps, which are redrawn automatically every time the layout of the network changes.
The mapping discovery procedure can also plot the network infrastructure that composes virtualizations and maps clients to hosts for VMWare and Hyper-V implementations. Maps can be exported into presentation formats for distribution and it is also possible to export them into Visio for further work.
The map development environment supports different network plans and can compile several perspectives from one scan. The icon library has a suitably diverse set of device representations to enable you to distinguish between types of network equipment visually on the map. You can also adapt existing icon designs to create your own.
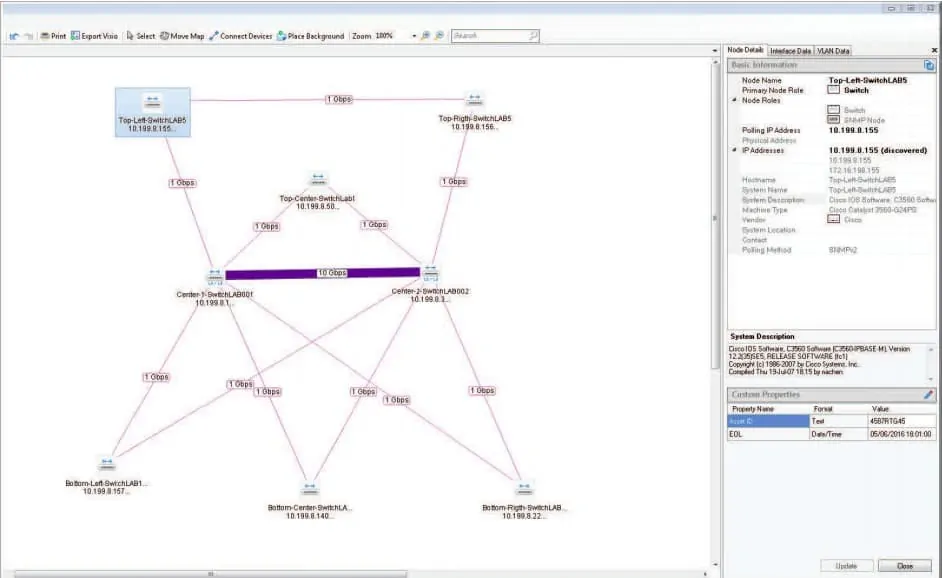
If you don’t want to use an automatically-generated map, you can set the discoverer tool to just create a device inventory, from which you can plot your own topology map. An auto-update feature would not be useful for a network plan for expansion. However, you can store different maps and set your current system topology to update automatically when alterations to the existing network occur.
Network Topology Mapper offers comprehensive automatic discovery of the network topology with intuitive diagram production. Supports a host of discovery methods. It can run on Windows 10, 8.1, 8, and 7 desktop OS and Windows Server 2003 and later, .Net 3.5 or later
Who is it recommended for?
There are many tools on this list that perform network mapping and then implement automated system monitoring. So, there probably aren’t many businesses that would prefer to have a tool that only provides maps. This tool would be a good service for very large businesses that don’t feel that the mapping included in automated monitoring services is good enough.
Pros:
- Uses autodiscover for automated mapping, great for larger more complex networks
- Uses multiple protocols to identify network devices, ICMP, SNMP, WMI, and CDP
- Designed to work in virtual environments and supports both VMWare and Hyper-V hosting
- Can build static maps and include devices from your network for capacity planning and testing
Cons:
- Would like to see a longer trial period
The network mapper is compliant with PCI and FIPS-2 standards. This software runs on Windows environments and you can access it on a 14-day free trial.
SolarWinds Network Topology Mapper
Start 14-day FREE Trial
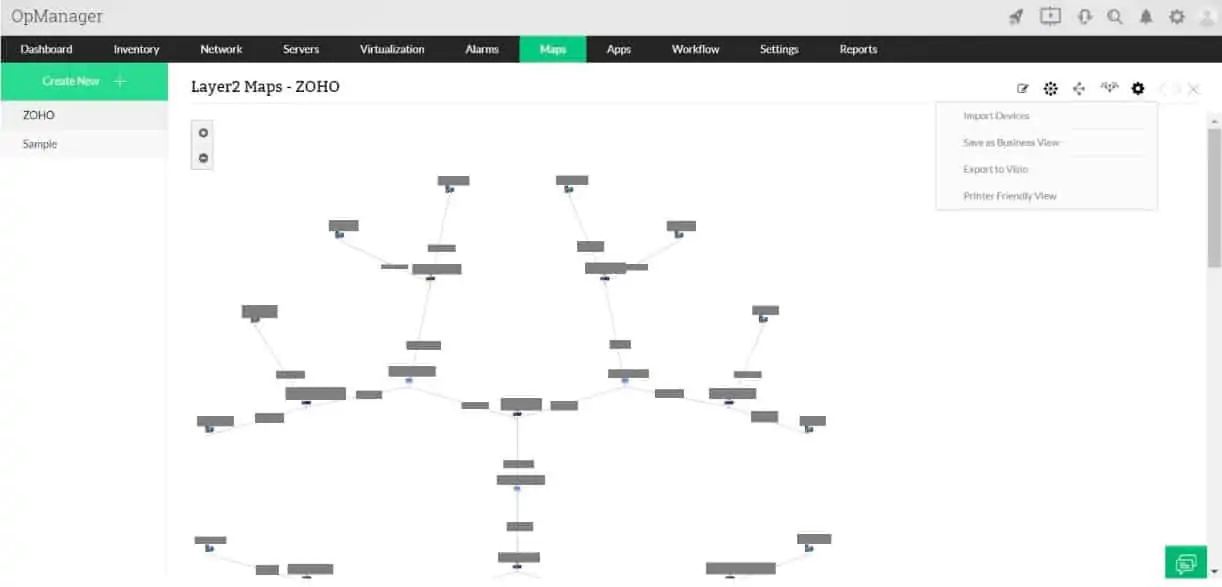
ManageEngine OpManager is a combination of network and server monitoring systems. It includes automated network discovery and topology mapping. As well as tracking and recording all physical connections, the system is able to monitor and map virtualizations and VLAN systems for VoIP.
Key Features:
- Maps virtual and physical networks
- Creates network inventory
- SNMP-based device monitoring
Why do we recommend it?
ManageEngine OpManager is the complete monitoring package for networks. It includes an autodiscovery service that continuously re-scans. With each search, the tool records all encountered devices and lists them in an inventory. From that inventory, OpManager generates topology maps in a variety of formats. OpManager also provides automated monitoring services for network devices.
The OpManager system runs its first system sweep with Ping and the Simple Network Management Protocol (SNMP) to identify every network device and endpoint on the system. It is able to record all information about each device, such as make, model, and operating system.
The network search also reveals how all of the equipment on the system connect together. This information is then made available to a network topology mapping in the monitoring bundle. The system discovery process is continuous, so it adjusts the network inventory whenever changes are made to the network.
The network topology maps are generated anew whenever the map module is accessed by the user. That means that the topology map that is displayed is always based on the latest version of the network inventory and is never out of date.
Who is it recommended for?
OpManager is suitable for networks of all sizes. Even very small networks can use it because there is a free version that is limited to monitoring three devices. The tool includes alerts on the discovery of a problem, so network managers know that everything is running smoothly unless they are notified otherwise.
Pros:
- Supports network and server monitoring capabilities built into the topology map
- Has an option to simulate and track physical connections, great for messy switches and larger complex networks
- Uses both Ping and SNMP to discover devices, making it more thorough than some smaller tools
- Maps are automatically redrawn when a device changes, keeping it up to date and accurate every time it is viewed
- Available on both Linux and Windows
Cons:
- Is a feature-rich tool that requires time spent with the product to fully learn all of its features
OpManager is delivered as on-premises software for Windows Server or Linux. The system is available for a 30-day free trial.
ManageEngine Network Mapping with OpManager
Download 30-day FREE Trial
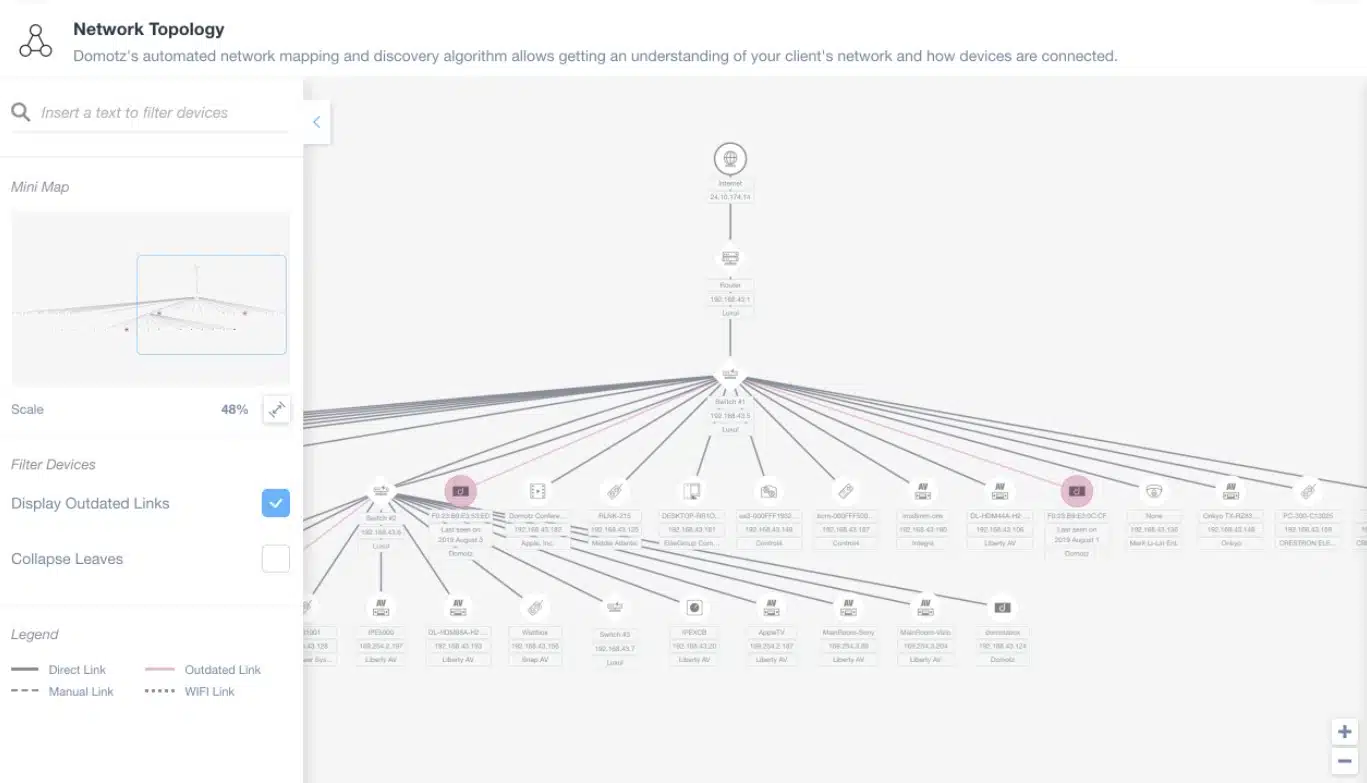
Domotz is a SaaS platform that offers network monitoring for IT Departments and it is also suitable for managed service providers (MSPs). The system offers a multi-tenant architecture and there is no limit to the number of user accounts that you can create for technicians to get access to the Domotz console. This tool can unify the monitoring of multiple sites and it includes an automated network mapping system.
Key Features:
- Automated network discovery
- A network asset inventory and network map
- Live network performance reporting
Why do we recommend it?
Domotz is a SaaS package so you don’t have to host the software on your own site. That also means that the system can monitor any network anywhere across the internet. This service discovers and maps your network and creates a network inventory. These services are constantly updated.
The Domotz system uses an agent on the monitored network and that program collects data for upload to the Domotz server. Processing is performed on the cloud server and that is also where the console for the system is hosted. The tool performs a network discovery routine, which is based on SNMP and other network protocols, and it repeats constantly, so data is always updated. This information goes into a network asset inventory and this database of devices is the source material for the network map. Whenever the inventory gets updated, the network map gets redrawn.
This system can monitor physical and virtual networks, plus wireless services. It will track the performance of endpoints, equipment, and IoT devices.
Who is it recommended for?
Domotz is very similar to Auvik and it includes constant automated network monitoring. This tool will optimize the valuable time of highly-paid network specialists and there is also a version available for use by managed service providers.
Domotz is a subscription service with a set price of $21 per network per month, regardless of the number of nodes on the network. There is also a custom plan, which is priced by negotiation. You can access Domotz with a 14-day free trial.
Domotz
Start 14-day FREE Trial
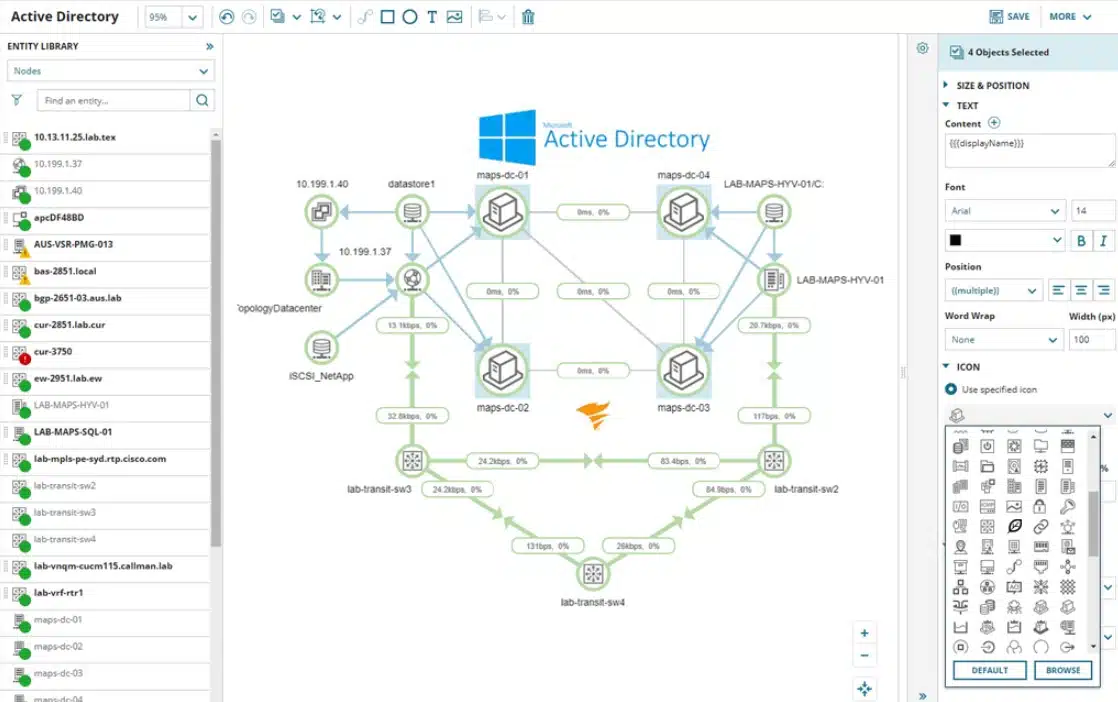
SolarWinds Hybrid Cloud Observability is an IT asset management service that automatically discovers devices on a network and extends its search out to cloud resources. The service creates an IT asset inventory from its discoveries and makes a topology mapping system available based on the device log.
Key Features:
- Autodiscovery
- Network topology mapping
- End-to-end path representation
- Application dependency mapping
Why do we recommend it?
SolarWinds Hybrid Cloud Observability is centered on a utility called NetPath. You choose two points on your network and the tool draws a map showing all the links and devices that traffic has to cross to get from one end to the other. The map also shows you the capacity of that hardware and the live traffic volumes that they are handling. Apart from that special feature, the system scans the network, creates an asset inventory, and draws up a network map. The system identifies links out to other platforms by tracking the activity of processes and it includes external systems and internet links in its maps.
The discovery and mapping service is able to examine virtualizations as well as physical infrastructure. It will identify the connections and relationships between VMs and hosts. There are two editions for Hybrid Cloud Observability: Essentials and Advanced. While both editions include the hypervisor discovery routine, there are extra virtualization performance monitoring services in the Advanced edition.
Who is it recommended for?
This system is similar to a typical network performance monitor excel that it extends its monitoring out to the cloud and across the internet to other sites. Therefore multi-site systems that also include the use of cloud platforms would benefit greatly from the Solarwinds Hybrid Cloud Observability system.
Pros:
- Automatically creates a system inventory and topology map
- Application dependency mapping
- Path analysis drawings
Cons:
- No SaaS version
The software for SolarWinds Hybrid Cloud Observability installs on Windows Server and you pay for it on a subscription rate per node per month. SolarWinds offers the Advanced edition for a 30-day free trial of the Advanced edition.
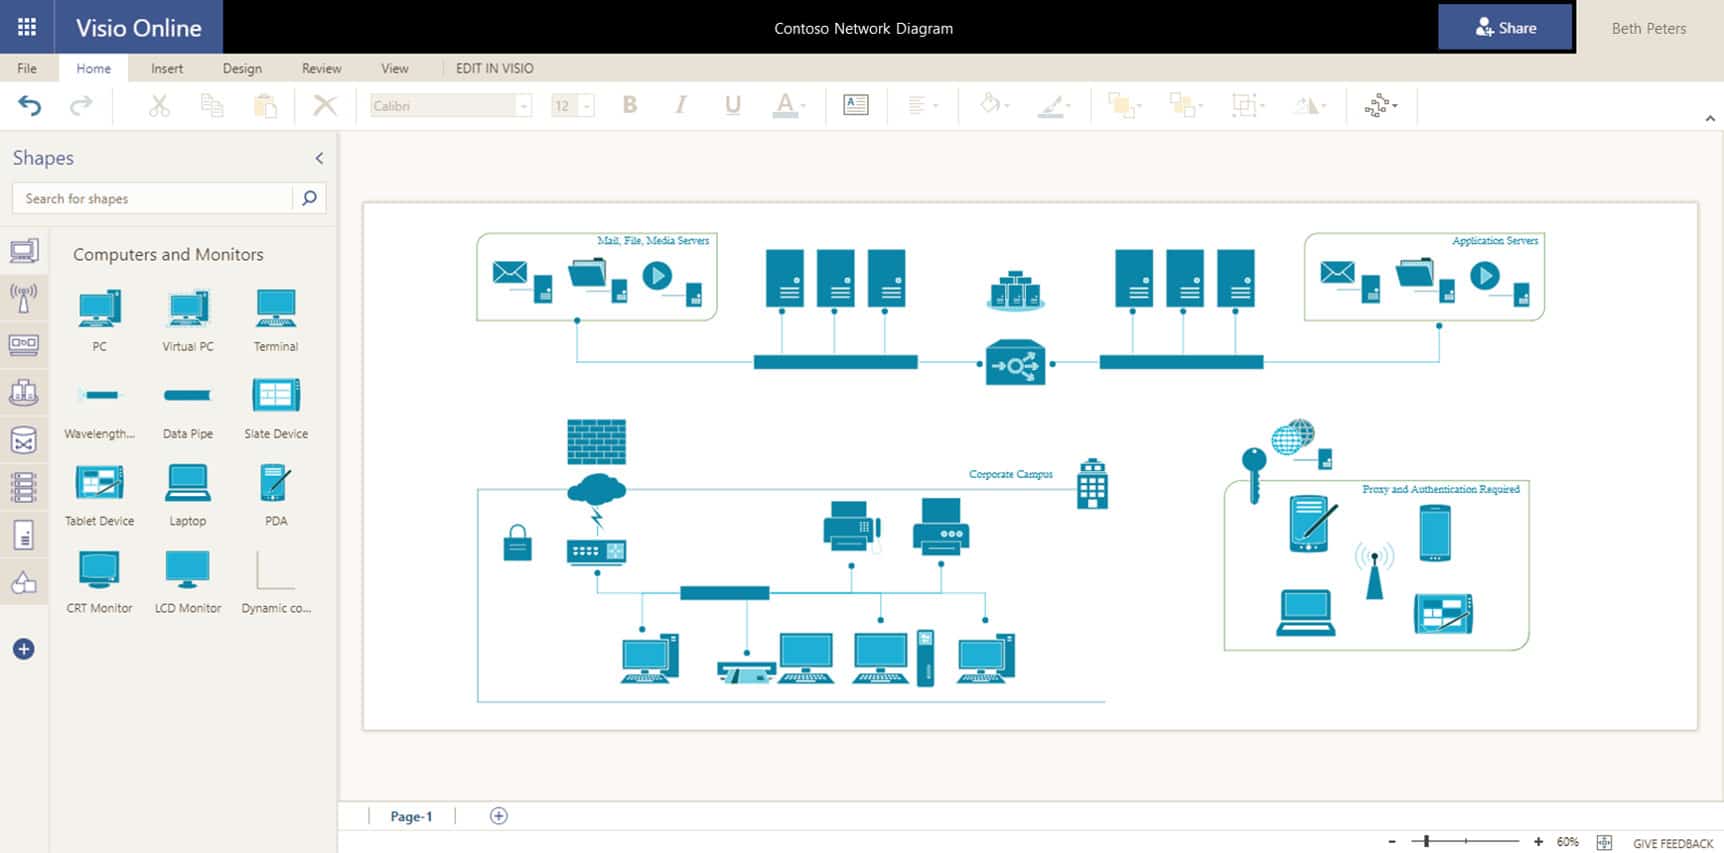
Visio is a high-end chart and map-creating tool and is widely-used throughout businesses for a range of tasks. It is possible that many managers in your enterprise already use Visio.
Key Features:
- Charting tool
- Network icon library
- Design-templates
- Add-on to Microsoft Office 365
Why do we recommend it?
Microsoft Visio is a chart-creation tool and it has a library of icons that include network device representations. This tool is a good choice for creating your own network maps.
Many other applications enable network maps to be exported to Visio, so you can use this tool to consolidate information from a range of sources.
As a leading design tool, Visio is a little pricey. However, it includes IT icons and network design templates to speed up your topology mapping tasks.
Who is it recommended for?
There is no network scanning function in Visio and the package isn’t dedicated to creating just network maps. You can use this system to create a wide range of charts. The Visio system would be a great tool for a network consultant who needs to create presentations as well as network maps. A network manager planning a new network without any existing equipment to scan would also benefit from Microsoft Visio.
Pros:
- Easy to use, part of the Microsoft Suite
- Good for network planning and theoretical designs
- Widely used file format
Cons:
- Only available in Windows
- Lacks live network auto-discovery builtin
- Fairly expensive when compared to its competitors
Visio runs on Windows environments and is also available online. It can be bought individually or added to Microsoft Office 365 at an additional cost.
See also: Application Mapping Tools
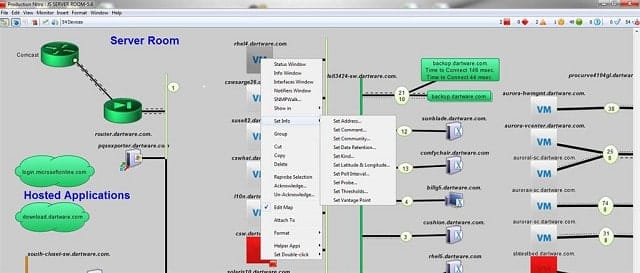
Fortra’s Intermapper is available in both a free and paid version. The tool includes discovery and an automatic mapping feature to get you started, alternatively you can create your own plan from scratch. The autodiscovery system is also capable of plotting virtualization as well as physical network topology.
Key Features:
- Autodiscovery and automatic map drawing
- Topology map editor
- Free version
Why do we recommend it?
Intermapper will scan your network and create a map, which forms the basis for the network monitoring system that is included in the package. The difference between Intermapper and other tools on this list is that the network scan isn’t automatic. You have to demand a refresh. This is actually a great benefit because the system allows you to alter network maps manually, which you can use to trial changes. Without an automatic refresh, your alterations are preserved.
The graphics editor includes a library of icons, and you can also create your own. Other features in the tool extend to network monitoring functions. It is also capable of storing network performance data to assist with capacity planning and SLA compliance reporting.
Who is it recommended for?
Although the basics of Intermapper are the same as the services offered by OpManager and other tools on this list. The Intermapper system isn’t quite as extensive as the ManageEngine tool. This can be an advantage for the managers of small networks who can be a little overwhelmed with all of the screens in larger network mapping and monitoring tools. Even better, Intermapper is free to use on networks with up to 10 devices.
Pros:
- Offers a free and paid version
- Is capable of using auto-discovery to find new devices
- Features SLA compliance reporting, good for MSPs and larger networks
- Available on Window, Linux, and Mac, making it a flexible option across multiple operating systems
Cons:
- Dated user interface is clunky
- Visual options are limited
- Maps are generally not visually appealing, not great if used in a presentation
The free version of the tool limits you to monitoring 10 devices. The paid version is available as a subscription service or you can buy it for a one-time fee. Charges are made per monitored device. The software runs on Windows, macOS, and Linux. You can get the paid version of the tool on a 30-day free trial.
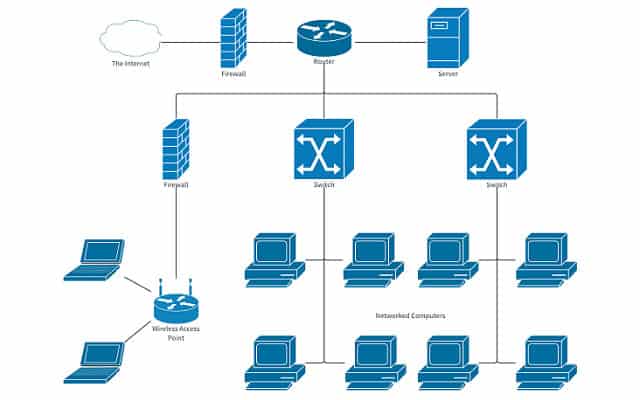
Lucidchart is a general flowchart creation topology tool that has specialized icon libraries for a range of industries, including network topology. You don’t get any autodiscovery features with this tool, but it would be a great option if you are creating a network from scratch.
Key Features:
- Import existing network maps
- Library of IT icons
- A free version
Why do we recommend it?
Lucidchart is very similar to Microsoft Visio. Like that rival graphics tool, Lucidchart can be used to create many different types of charts. The package includes templates and also libraries of icons and you can design a network by accessing the network icon list.
You can import and export maps in a range of formats, including Visio. That means that you can import maps of existing networks from any tool that exports in Visio format.
This is a pure chart editor, so you don’t pay per device, you pay per user account. There is also a free version, which doesn’t include an import/export feature. There is also a free version, which can only be used to create or edit three charts per month. The paid version is offered in three editions: Individual, Team, and Enterprise. The two higher plans let you create many user accounts on the Lucdchart system. Those users have the option of sharing chart editing or sending finished charts to those who aren’t registered as users within the system.
Who is it recommended for?
With no discovery service, this tool is intended for planning new networks rather than documenting existing systems. Thus, the tool is ideal for a network engineering consultant or the network manager hired to set up a network for a startup.
Pros:
- Uses a simple color scheme and interface that makes maps look great
- Features a free and paid version
- Can import maps saved in Visio format, making this a good option if you plan to ditch Visio
- Team version allows for collaboration
- Is available multi-platform as well as on iOS and Android devices
Cons:
- No autodiscovery
- Does not support live devices in any way, is strictly a charting software
The software for the service installs on Windows, Linux, macOS, Chrome OS, iOS, and Android. You can try the paid version for free for seven days. The system can also be accessed through Google Apps.
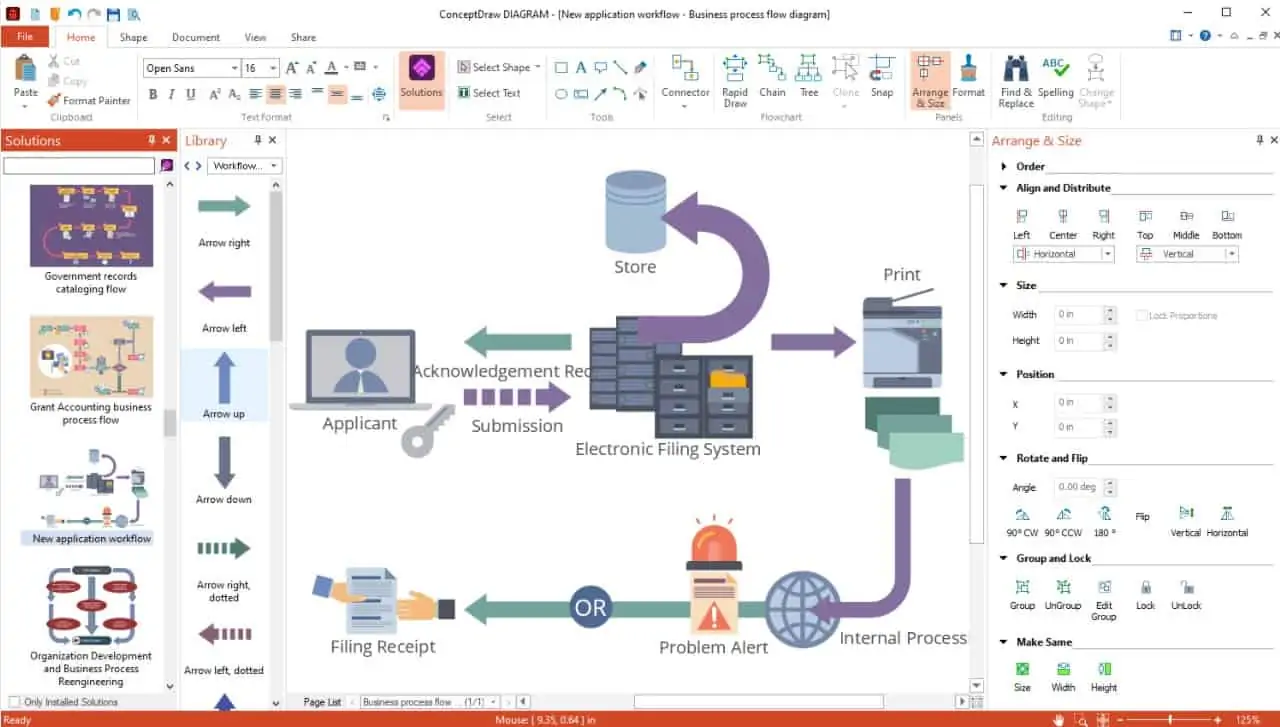
ConceptDraw Diagram is a map-creating tool that has specialized templates and icons for network mapping. You can import and export maps in various formats, including Visio.
Key Features:
- Import existing maps
- Compatible with Visio
- IT icons
Why do we recommend it?
ConceptDraw Diagram is a third option for those who need a general chart creation tool that has a network mapping library. There is little to choose between this package, Microsoft Visio, and Lucidchart.
The tool also integrates with a range of productivity software, including Microsoft Office and Google G Suite.
Who is it recommended for?
The use cases for ConceptDraw Diagram are the same as those For Microsoft Visio. This tool is useful for planning a new network rather than documenting an existing system.
Pros:
- Lightweight tool that uses very little system resources
- Supports Visio file format
- Integrates well with other tools like Office and Google, making it a flexible option for users who use those tools
- Supported on Windows and Mac
Cons:
- No autodiscover functionality
- Does not support live devices in any way, is strictly a charting software
- Graphics and interface feel outdated
This tool can be bought individually or as part of a tool package, called ConceptDraw Office. That suite includes project management and planning utilities. The software can be installed on Windows or macOS.

Edraw is a general map, plan, and chart creation tool that includes some great formats for network topology mapping. The editor has libraries of network and IT equipment in different styles, including Basic, Detailed, and 3D.
Key Features:
- 3D-maps possible
- IT icon library
- Network map templates
Why do we recommend it?
Edraw Max is another option for those who want to plan a new network rather than map an existing system. The functions of this tool are similar to those of Microsoft Vision because it has a range of charting applications and can be used for network map creation by accessing the network icon library.
It also has libraries of icons that derive from Cisco, AWS, Azure, and Google Cloud Platform, so you can create network maps that look as though they came straight from a professional graphics artist. Different perspectives available in the tool include Rack View, LDAP, and Active Directory mapping, and a physical world view that includes icons of cities and offices if you need to draw a WAN.
Who is it recommended for?
As with the other chart creation tools on this list, Edraw Max is a good choice for networking consultants and the network managers of startups.
Pros:
- Extremely detailed, can map out rack views, LDAP connections, and permission relationships
- Supports 2D and 3D views
- Available for Windows, Linux, and Mac
Cons:
- Dated and cluttered interface can feel overwhelming
- Lacks a live network component
- Cannot monitor devices on a network
- Lacks integrations found in similar tools
Edraw has a stable of products with different specializations. For network mapping, you need to look at Edraw Max, which is available on a free trial. The software installs on Windows, macOS, and Linux.
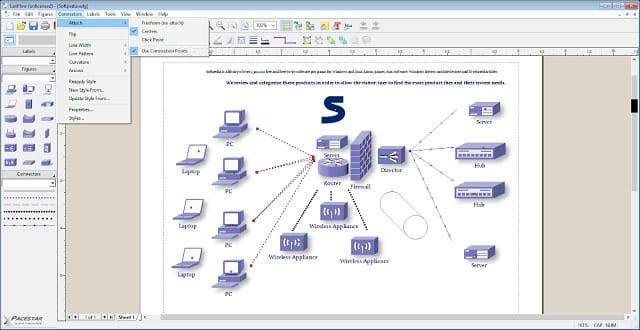
LanFlow Net Diagrammer is produced by Pacestar Software. The package includes libraries of 2D and 3D icons to enable you to create your own network topology maps.
Key Features:
- IT icon library
- Customizable icons
- Drag-and-drop editor
Why do we recommend it?
LanFlow is a graphics editor that is specifically designed for the creation of network maps. An interesting feature of this package is that, as well as providing a library of network icons, it enables you to create your own.
You can also create your own icons or import them from other graphics tools. The editor employs a drag-and-drop methodology that allows you to select icons from a side panel and place them on the design board.
Who is it recommended for?
LanFlow, like the other network design tools on this list, is suitable for use by network consultants and network engineers that need to plan a new network.
Pros:
- Uses a simple, but effective interface that is easy to use even for non-technical users
- Supports 2D and 3D modeling, good for presentations
- Can build your own icons, making it highly customizable
Cons:
- Only available for Windows
- Does not support auto-discovery
- Does not support live device management
This is a paid product, but you can get it for evaluation on a 30-day free trial. Don’t try using the free trial version for your business, because it will print a message saying that this is the trial copy on all network diagrams. The software installs on Windows.
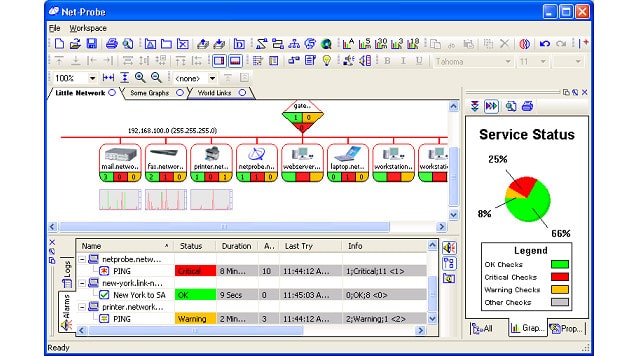
Net-Probe is a little more than a network mapping tool – it is really a network monitoring system and it will discover your network for you. The network maps of the system can be overlaid on real-world maps if you run a WAN. There is also a classic network diagram format included in the tool.
Key Features:
- Autodiscovery and automated map drawing
- Real-word maps for WANs
- Network monitoring
Why do we recommend it?
Net-Probe is a network monitoring system that includes a discovery and mapping function. This service isn’t as sophisticated as the ManageEngine or SolarWinds packages on this list. However, its simplicity can be an advantage because it focuses attention on just a few issues that are vital for continuing good network performance.
The autodiscovery feature will compile a hardware inventory for you, so if you are organizing your network, you can ignore the generated topology plan and work from the hardware list. A live map will show device statuses on equipment icons and also list alerts in a separate window.
This is a very helpful little tool, but it doesn’t have the backing of a big corporation, so support is not so great. The software runs on Windows and the Standard version is available for free. This will monitor up to eight devices.
Who is it recommended for?
The network administrators of small networks would enjoy using this tool. The free version sounds appealing but it lacks some vital features, such as Ping and TraceRoute, so it is worth paying for one of the higher editions to get those tools.
Pros:
- Highly detailed, great of admins who are looking for a detailed lightweight tool
- Has a free and paid version
- Can map WAN networks over a physical map
- Supports autodiscovery for live network mapping
Cons:
- Only available for Windows
- Interface is crowded and outdated
- Can be complicated to use, not the most user-friendly option
This doesn’t include most of the features of the tool, such as Ping, Traceroute, and network scanning. The paid versions are the Pro, to monitor up to 20 devices, Deluxe, to monitor up to 45 devices, and Enterprise, which will monitor up to 400 devices.
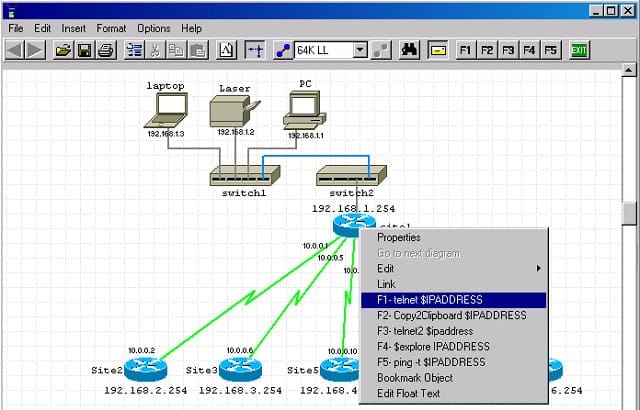
Network Notepad is available both as free and paid versions. The software runs on Windows and has a small footprint. You can expand the paid mapper, which is called Network Notepad Professional Edition, and make it into a network monitor by adding on NNMonitor, which is a Ping tool.
Key Features:
- Network discovery feature
- Automated network mapping
- Network monitoring
Why do we recommend it?
Network Notepad presents a number of usage options. Essentially, it is a graphics editor for the manual creation of a network map. This is a free tool but you can upgrade to a paid version to get autodiscovery and automated mapping. The package also provides a basic network device availability tester that is based on Ping.
The basic Network Notepad includes a rudimentary discovery system based on Cisco Discovery Protocol. However, you will probably use this tool more as a network map designer. The editing screen gives you all of the icons that you need to clearly depict your network and the map is built using drag-and-drop. If you use CDP to locate all of your devices, the attributes discovered by that process can be pulled into the descriptions of the network nodes in your map.
Who is it recommended for?
Network Notepad is a combination tool. Use it to design a new network, discover an existing network and get a map of it that you can adjust, or get it to discover, map, and monitor a network. This system is appropriate for planning or discovering a small network.
Pros:
- Supports two versions, one for network mapping and another for simple charting
- Barebones interface makes this a lightweight and clutter-free tool
- Supports in-depth networking details like VLANs, subnets, and address pool
Cons:
- Only available for Windows
- Only uses ping to discover devices
You can run Network Notepad on Windows 10, 8, 7, Vista, XP, and 2000. The Freeware Edition is easy to download and you can get a 30-day free trial of the Professional Edition and the Enterprise Edition.
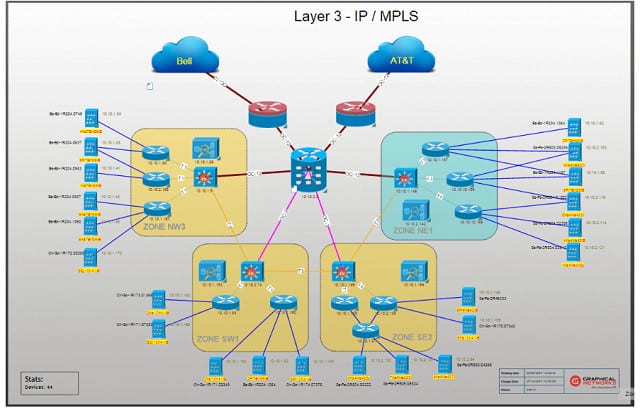
Graphical Networks produces a range of network management software, including netTerrain Logical. This is an automated network documentation system that will compile a hardware inventory and generate network topology maps by probing the network.
Key Features:
- Network discovery
- Automated mapping
- Supports capacity planning
Why do we recommend it?
The purpose of netTerrain Logical is to support IT asset inventories. There are a number of functions in this tool for inventory management but the most attractive is its network discovery and automatic mapping tool. The package provides a range of layout options and you can switch from one view to another with ease.
You don’t have to stick with those generated maps because you can adjust the topology to meet your specific project aims.
The netTerrain tool supports capacity planning and network reorganization. Extra features help you identify and shut down security weaknesses on your network. This topology tool is Visio-compatible, which gives you the opportunity to exchange data from netTerrain Logical to a range of other Visio-aligned tools.
Who is it recommended for?
This tool is not a network monitor but is limited to documenting a network and creating an inventory and a map. Network managers that are happy with their network monitoring tool but dissatisfied with its mapping capabilities should consider netTerrain Logical.
Pros:
- Can automatically discover devices on a network and produce a map
- Supports capacity planning and network restructuring
- Compatible with Visio format
Cons:
- Only available for Windows
- Interface feels outdated
- Icons are a bit limited
The tool installs on Windows Server 2012 and higher. You can get a free demo of the system to try it out before you buy.
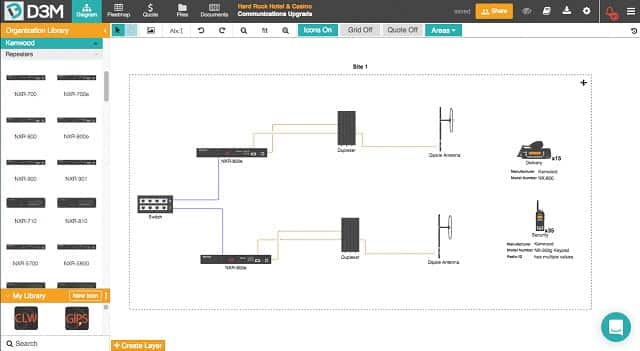
D3M caters to a unique niche market – IT sales professionals. This network mapping tool can be used to plan out a customer’s requirements, compiling an inventory of necessary network equipment as the topology map builds. If you set up a product library with prices, the inventory will also copy to a bid with a total equipment cost calculated on it automatically. Icons used in the map are provided by equipment manufacturers, so customers will be able to see exactly which make and model of device goes where.
Key Features:
- Designed for network services sales executives
- Accessible by mobile app
- Cloud storage included
Why do we recommend it?
DM3 support sales staff when assisting a client to plan their requirements and suggesting items from the company’s sales list to meet those needs. This is the reverse of the tools on the list that scan a network and compile an inventory. Instead, the system requires an inventory to be entered and then allows the user to select from that list of products when designing a new network.
You don’t have to be a sales professional to use this tool, so it would work just as well for an IT department that needs to plan, adapt, and expand a busy network for an organization. The concept of providing a service for workers in the field means that the tool was designed for collaboration and presentation. Plans can be stored on the Cloud and mobile apps make design and retrieval possible from anywhere.
Who is it recommended for?
This tool is designed for use by sales staff and it is linked to a list of available products. Although network engineers can use the tool to create a plan for a new network, you need to set up an inventory first, which means you would already have decided which devices to buy before creating the plan and discovering which are really necessary.
Pros:
- Great for sales or MSPs who use network mapping for client presentations
- Interface is simple and sleek
- Has options to include pricing for devices and services in the map
- Supports cloud storage
- Is available on mobile devices
Cons:
- Is on the more expensive end of the spectrum
- More focused on presentations, less on live network monitoring
- Not the best fit for users wanting to map live devices
The tool is pricey, but you can get your first project completed for free. There is no limit on the number of projects you can use the tool for after that first free trial. There are three charging bands for the system, which work on the number of users that you want to access the tool. The service is charged on a subscription basis with a monthly fee.
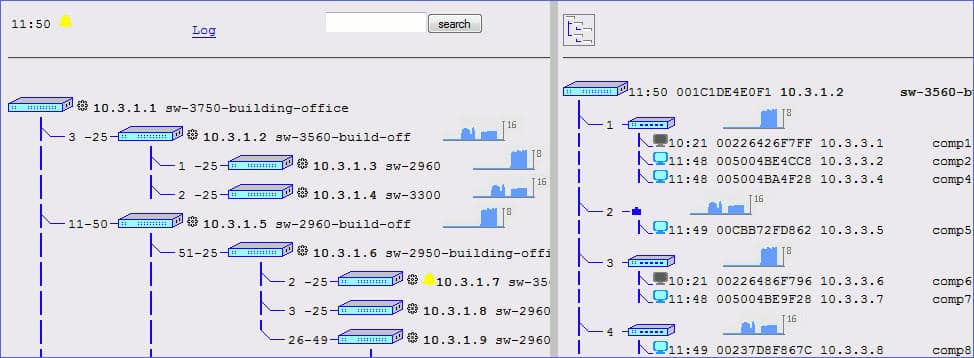
LANTopoLog is a free enthusiast-created network mapper. You don’t get a concept of the physical layout of your network from this topology tool. However, the information displayed in the map gives you a very straightforward representation of all the network data that you need quickly.
Key Features:
- Network discovery
- Rudimentary network map
- Free to use
Why do we recommend it?
LANTopoLog is a network mapper that is completely free to use. The system includes a discovery service that will identify all of your devices and then create a network map for you. It isn’t accurate to call that a topology map because you get no sense of the proximity or distance between connected devices. Instead, you get a hierarchical view of your network
The tool includes a network discovery facility, which is based on SNMP. The resulting map, which is drawn automatically, shows each of the devices in your network and the devices that it connects to. The result of this schematic is a tree structure that gives the IP addresses, port numbers, and hostnames of each device and its connections.
This is a rudimentary network monitoring system. Its use as a network mapping tool lies in the list of discovered devices, which you could use as an inventory. This provides you with the current connections between your devices, which you could use as a guide when replanning your network in a graphics tool, such as Visio. This software runs on Windows environments.
Who is it recommended for?
LANTopoLog is a useful tool for anyone who doesn’t want to pay for a network mapping system. The hierarchical layout of the map can be good for when you are planning or reorganizing the connections to each of your switches. That is, you could use a more sophisticated map from another tool to work out where your network devices are and then use this map to examine the utilization of switch ports.
Pros:
- Completely free tool
- Supports autodiscovery
- Good option for a fast, barebones look into a network
Cons:
- Only uses SNMP to find new devices
- Only available for Windows
- Outdated and cluttered interface makes mapping larger networks messy
- Not the most user-friendly option
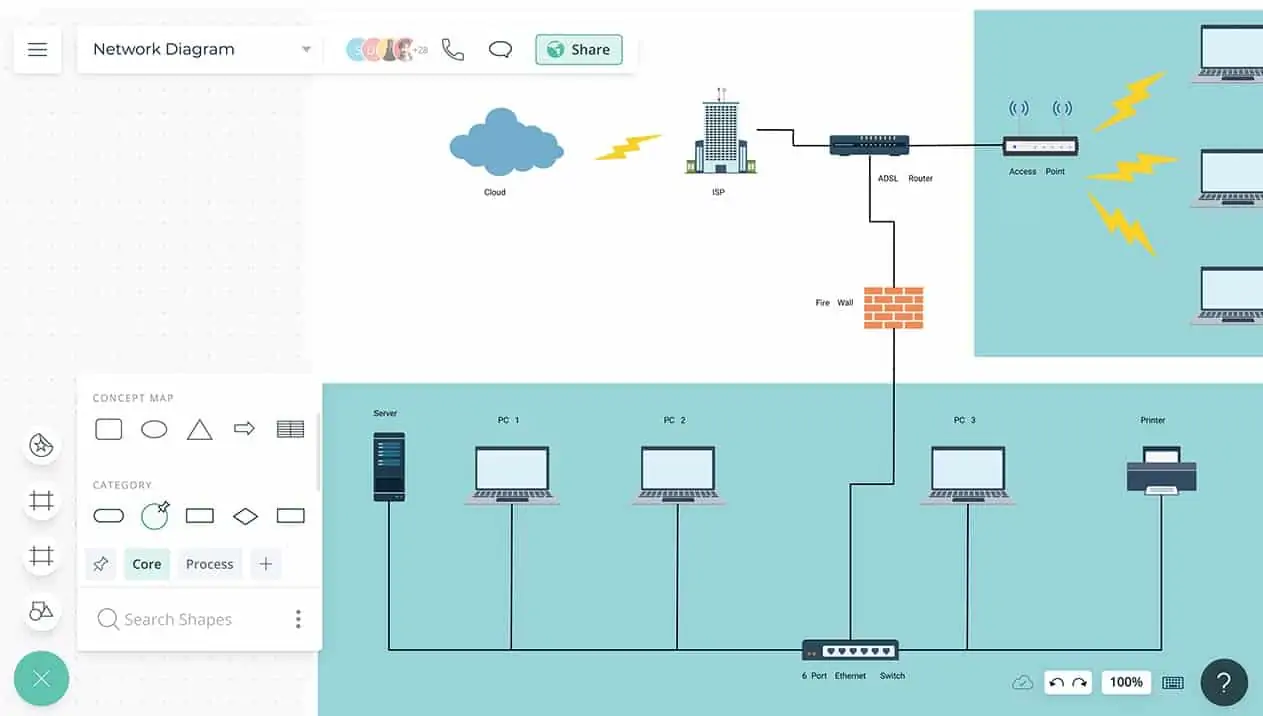
Creately is a neat chart-creating tool that has specialized templates and icons for network mapping. This is a pure topology design tool and doesn’t include any autodiscovery options. However, you could use this designer in conjunction with a basic network explorer, such as LANTopoLog to get the best of both worlds.
Key Features:
- Diagram editor
- Network icon library
- On-premises or cloud-based
Why do we recommend it?
Creately is another option for those who want to use a chart creation tool to create a range of diagrams, including a network map. There is no network discovery function in this tool and you can’t import a map created by a monitoring tool. You would use Creately to draw up a new network.
The package includes a large selection of templates, which each come with a set of icons. The layouts available include WAN views that feature city and cloud icons. You also get the standard LAN layout option and you can even create rack views.
The Creately system allows you to set up accounts for members of your team and there is a collaboration feature built into the tool, which enables you to grant editing or viewing access to other users.
Who is it recommended for?
As it doesn’t have a discovery function, Creately is suited to designing a new network. So, it is likely users of this package would be network consultancies or the network manager of a new company.
Pros:
- Built-in collaboration tools for teams
- Supported across Windows, Linux, Mac as well as on mobile devices
- Can be purchased as either a standalone or cloud product
- Can create racks views and map physical connections
Cons:
- No auto discovery options
- Does not tap into live networks, cannot pull device information
- Icons are limited and a bit dated
The software can be installed on Windows, Linux, and macOS and access can be granted to users of mobile devices that run iOS or Android. You can also opt to get Creately as a Cloud service. You can try the package by accessing a demo account.
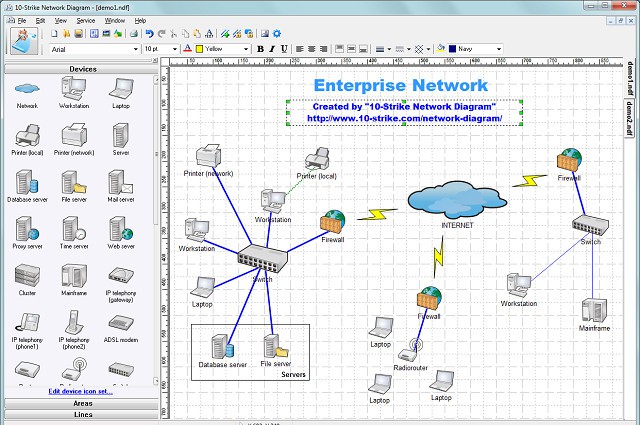
The 10-Strike Network Diagram tool is a dedicated network map creator with autodiscovery capabilities. You don’t have to use the autodiscovery option in cases such as starting the design of a completely new network. The package features a graphics editor, which is the main utility of the software. The editor includes a library of IT icons that you can drag and drop onto the design pad.
Key Features:
- Network discovery
- Automatic map creation
- World map view option
Why do we recommend it?
10-Strike Network Diagram is a network planning tool that has an on-demand network discovery function that can boost your progress by populating your plan with the existing network as a starting point. The tool has a library of network device icons that lets you work out how to change your existing network or create a new one from scratch.
Views available within the package include a real-world map, which is based on Google maps. The autodiscovery feature will even trace your connections across the internet, plotting the location of each router as it passes through the real-world map.
Who is it recommended for?
Network consultants and network managers would all benefit from this tool. It is a useful both for exploring an existing network and also for creating a brand-new network. The system can be used to map a network of any size.
Pros:
- Supports both auto discovery as well as static diagram mapping
- Has a variety of network icons as well as other icons, giving it dual functionality
- Networks can be physically mapped using Google Maps and a traceroute feature
Cons:
- Available only for Windows
- Interface needs works, specifically around the toolbar menus
This software runs on Windows environments and you can get it on a 30-day trial.
Related post: Network Magic Alternatives
Choosing network mapping software
As you can see from our list, there is a wide range of mapping tools available to you. The best tool for your project will depend on whether you are creating a new network or adapting an existing one.
Network Mapping Software FAQs
Do I need autodiscovery?
Some tools have monitor-integrated topology mappers that automatically monitor and update changes in the network’s inventory which is great for managing changes.
An automated mapper isn’t always the best solution. Sometimes, you would be better off being able to create your own topology maps through a graphics tool. This is particularly the case if you are designing a new network or planning to extend an existing one. In these cases, autodiscovery won’t help you.
How do I create a network map?
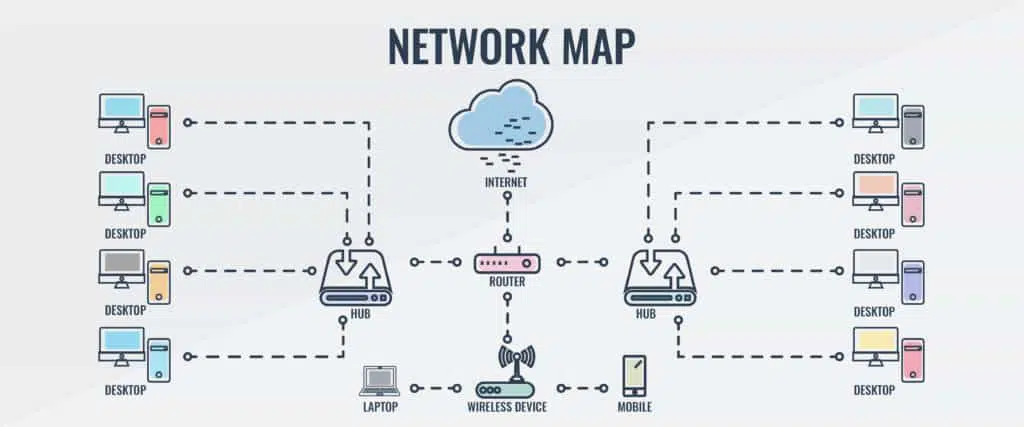
You could just create your own drawing in any graphics package, including the free Paint that is integrated into Windows. However, to be considered as a specific network design support tool, a graphics package needs to have the following attributes:
- An icon library that clearly depicts distinct device types
- Editable attributes for plotted devices
- Distinguishable link types
- Icon label options
What are the types of network topology?
In our related post on network topologies, we get into a lot of detail on each of the common network topologies and their appropriateness for each situation. We also discuss the advantages and disadvantages of each type. These are the most common network topologies:
- Bus Topology – every network device is connected to a single cable that runs the length of the entire network with two endpoints.
- Ring Topology – all network devices are connected in line, each has two neighbors, forming a continuous loop with no endpoints. Typically the flow of network data is unidirectional.
- Dual Ring Topology – a ring topology where each device has two connections to each neighboring network device which allows for bidirectional data flow.
- Star Topology – all network nodes are connected to each other via a central node
- Tree Topology – typically a hierarchical tree structure with a root node and branch connections forming parent-child hierarchies
- Mesh Topology – point-to-point connected devices that allow for various data routing techniques
- Hybrid Topology – typically comprised of two or more common types of network topologies mentioned above
What Is Network Mapping?
Network mapping is a visual record of the layout of all devices in the network. It shows how those devices connect together. Topology mapping is often partnered by an autodiscovery feature that discovers all of the devices to be mapped and records their connections.
Why should I use Network Mapping?
Network mapping gives you an easy-to-recognize look at the layout of the network. It is easier to digest than a dry list of devices and their connections. With a topology map, you can trace paths end-to-end from one device to another.
What is the best software to draw network diagrams?
Our research indicates that the SolarWinds Network Topology Mapper is the best software to draw network diagrams because this creates the network topology diagrams automatically while letting you make manual adjustments. For most purposes, you will also be served well by using Microsoft Visio, Intermapper, Lucidchart, and ConceptDraw Pro along with most other tools mentioned in this post.
Which topology is the best topology?
The best topology for networks is the star topology. All devices are linked to a switch with a cable plugging into a separate socket for each device. Switches themselves are then linked together in order to cover the entire enterprise. Wireless networks model the star topology.
What is the difference between a logical network diagram and a physical network diagram?
A logical network diagram shows the links between all devices in a schematic style. A physical network diagram adjusts the links between devices to accurately depict distances. Some network topology mappers will show the real network with actual device locations plotted onto floor plans and real-world maps.
How do I map all devices on my network?
The easiest way to get a full map of all devices on your network is to use a network topology mapper. If you don’t want to use a standard format for your network diagram, look for a network topology mapper than has a range of templates to choose from or one that allows you to manually change the generated network map.
See also: Network Topologies: The Advantages and Disadvantages of Each
Do you have a favorite network mapping tool? Do you use any of the topology tools on our list? Leave a message in the comments section and share your experience with the community.
Related: Guide to Network Topologies


![Toni Kroos là ai? [ sự thật về tiểu sử đầy đủ Toni Kroos ]](https://evbn.org/wp-content/uploads/New-Project-6635-1671934592.jpg)


