
12 Best Network Latency Testing Tools for 2023 & Test Guide

When you are running a network for a company, delivery speed is vitally important. Not only do you need to make sure that you have good response times, but you need to ensure that the speed of the network is adequate on every single path that your users’ communications will take.
That is a lot of work and testing every path manually will take up all of your time. You need to get a testing tool to ensure that latency does not impair your network’s performance.
You can look for latency testing tools that form part of broader utilities, or you could just narrow your search to simple tools that offer an augmented Ping service.
Mục Lục
Here is our list of the twelve best network latency testing tools:
What is network latency?
Latency is the speed of traffic on your network. As such, you can’t really speak in terms of ‘good’ or ‘bad’ latency. Acceptable transfer times vary according to the application being used. Video playback and interactive VoIP calls need faster speeds than email delivery. So, you need to work out what speeds you need for your network traffic in terms of the services you provide to your users.

Measuring latency
Latency is always expressed in milliseconds (ms). However, there are two metrics that express latency. Whichever you choose to use for the tests on your network, try to keep all records in the same test category.
The most common measure of latency is called ‘round trip time’ (RTT). As the name suggests, this is the time it takes for a packet to get from one point on the network to another. The alternative measurement is called ‘time to first byte’ (TTFB). This records the time difference between the moment the first part of a packet left one point on the network and the time that it arrived at the destination. RTT is used more frequently than TTFB because it can be run from one location and doesn’t require special data collection software to be installed on the remote destination.
Using Ping
Every network-connected computer has a free latency testing tool built into the operating system, which is called Ping. This facility works on the Internet Layer protocol, the Internet Control Message Protocol (ICMP). Every network administrator uses Ping and it is a useful tool for a quick check. You don’t need to install any software on the remote computer and you get a report back to the computer from which you launch the command.
A typical Ping execution will send 32 bytes of data to a given destination and record the time that a response arrived back. The latency is expressed as the round trip time that includes both the transfer time for the test packet and the response packet. That time is shown in milliseconds.
You don’t have to know the destination IP address if you are testing the RTT to a website because Ping will accept the domain name as an address instead of the actual IP address. By default, Ping will send out four test packets, but an option on the command enables you to specify a different number of tests.
The results of the Ping command shows the RTT for each test and then summarizes the results. You will see the number of packets sent, the number of responses received, and the number of packets that were lost. You will also see the lost packet tally expressed as a percentage of all tests made. A second summary line shows you the minimum, maximum, and average round trip time for the test batch.
Problems with Ping
Ping is great for a quick investigation when a specific path seems to be running slow. However, the tool isn’t going to help you fix latency problems and it doesn’t allow you to check multiple paths with one command. Fortunately, several more sophisticated Ping-based tools are available. These usually enable you to test multiple paths from the same console. You can also often run a Ping test continually with some tools. These constant Ping tools give a live display on the results of the latency test.
Latency solutions
Latency is a complicated issue that can be managed through traffic shaping methods, such as queuing algorithms. You can prioritize some traffic with a range of ‘quality of service’ (QoS) methodologies. These enable you to get time-sensitive application traffic through all network devices ahead of all other traffic. This is great if you provide live video delivery of IP telephony apps on your network.
Giving some traffic a clear run through the switches and routers on your network can cause other traffic types to get held up. However, a few minutes of delay in the transfer of an email is a price worth paying if it saves you from replacing your network cable to provide enough bandwidth for all of your traffic to get through at top speed.
There are some great network latency testing tools out there. Many will enable you to test other network conditions as well. For example, jitter is a measure of the variation of the arrival rate of packets in a stream. An irregular pace in the arrival of packets can cause just as many service problems with video streaming and IP telephony as slow delivery.
Another useful metric is the available bandwidth on each stretch of your network – you should keep track of the potential capacity, the median utilization, and the maximum utilization of those links.
This information will enable you to plan for capacity requirements when your business managers ask for new software to run over the network, or to add on new endpoints for increases in staff levels.
Our methodology for selecting a network latency testing tool
We reviewed the market for latency testers and analyzed tools based on the following criteria:
- A service that can report on delay and jitter
- A system that also provides availability monitoring
- Traffic monitoring features
- Options for on-demand or repetitive and automated latency tests
- An alerting mechanism for when latency becomes unacceptable
- A free trial of a paid tool for a cost-free assessment
- A paid tool that is worth the money or a free tool that is worth installing
With these selection criteria in mind, we arrived at a list of excellent latency testing systems. We made sure to include both free and paid options.
Paessler PRTG is a comprehensive network infrastructure monitoring tool. It covers networks, servers, and applications. The PRTG system is composed of many utilities, which are called ‘sensors’. Each sensor monitors a piece of hardware, a system condition, or a service.
Key Features:
- Ping based
- Local networks and internet connections
- Continuous checks
- QoS sensor
- IP-SLA tests
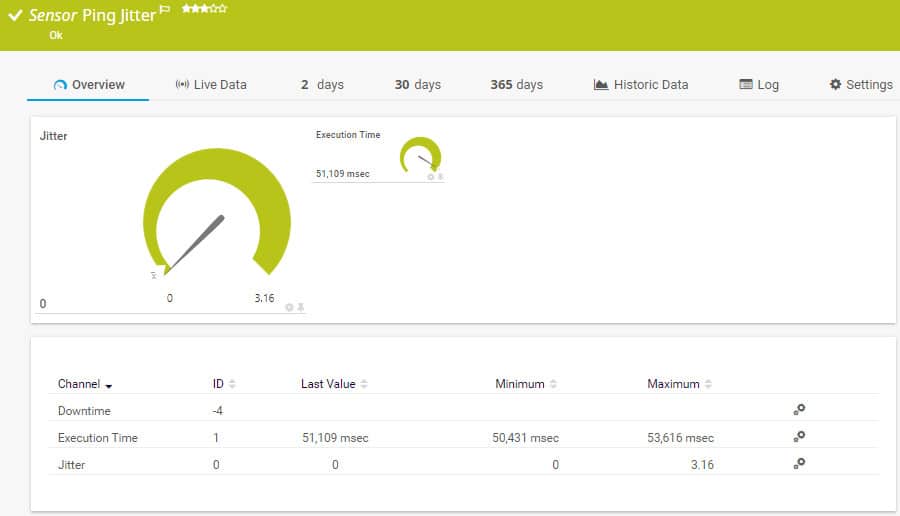
One of the sensors available in the PRTG package is a Ping Jitter Sensor. This tool is included to create checks on network device availability, but it also gives you the round-trip latency time of packets to those destinations.
The PRTG package includes a couple of other sensors that will give you some great latency measurements. These are the Cisco IP SLA sensors. The latency information this sensor gives you all relate to factors that can damage the quality of VoIP connections. These factors include round-trip time, packet arrival sequence, packet loss, and jitter. Another latency measuring option in PRTG is the QoS sensor. This is actually two sensors. One gives you the round trip time of packets and the other is a one-way latency, so this is one of the few tools available to provide the time to the first-byte metric.
Pros:
- A great option for businesses looking to also implement monitoring for their applications and servers alongside their network
- Highly customizable sensors allow administrators to build their own custom solutions
- Dozens of sensor templates support some of the most popular applications and devices
- Autodiscovery maps out bottlenecks and provides insights for stopping latency issues
Cons:
- PRTG is a highly detailed platform that requires time to fully explore all of its features
Every customer gets the full PRTG software package. The pricing model for the system depends on the number of sensors that the customer turns on. If you only activate up to 100 sensors, you can use the system for free. Paessler offers a 30-day free trial of PRTG with unlimited sensors.
EDITOR’S CHOICE
Paessler PRTG is our top choice for network latency management because it combines regular device monitoring with traffic analysis features. The PRTG system includes procedures that deploy SNMP, ICMP, and NetFlow, among other protocols to combine constant live network monitoring with excellent analysis and planning features.
Download: Start 30-day FREE Trial
Official Site: paessler.com/download/prtg-download
OS: Windows Server 2012 or later
SolarWinds produces an excellent range of infrastructure monitoring tools and its core module is the Network Performance Monitor. All of SolarWinds’s system management systems are written on a common platform, so they can all interact to create a total management system.
Key Features:
- On-demand latency tester
- SNMP performance monitoring
- Quality of Experience dashboard
- Network topology maps
This monitoring tool can keep check on all of your network devices. Most of the monitoring system is informed by the SNMP messaging system. This enables devices to notify the central controller of any performance issues.
The Network Performance Monitor includes latency testing facilities in the Quality of Experience dashboard. This shows network response times and network latency.
The benefit of buying in a complete monitoring system rather than just a latency test utility is that the discovery of slow segments is just the first task – you then have to fix the problem. Data gathered by the Network Performance monitor will help you work out exactly what is causing traffic to be delivered slowly. You can spot which network devices are experiencing errors and which are overloaded.
You will also be able to get information that Ping can’t tell about why your users are experiencing poor response times. Imagine if you get complaints of slow performance at the Help Desk but your Ping time test shows no problem. Slow software delivery is not always the fault of the network. With a full performance monitor, you will be able to identify bottlenecks on paths, congestion on ports, and overloaded CPUs on servers.
If you opt for the SolarWinds Network Bandwidth Analyzer Pack, you can enhance your traffic monitoring capabilities. In this pack, you get the SolarWinds NetFlow Traffic Analyzer as well as the Network Performance Manager. This tool increases information on network activities by examining traffic volumes between network devices.
All of these SolarWinds products install on Windows Server. You can get a 30-day free trial of the Network Performance Monitor, the NetFlow Traffic Analyzer and the Network Bandwidth Analyzer Pack.
For a free network testing tool, give the SolarWinds Flow Tool Bundle a try. This set of tools uses NetFlow v5, which was invented by Cisco Systems. NetFlow captures packet headers as they pass through the router and the system is also capable of compiling aggregated summaries of traffic data directly in the router.
Once you have captured passing packet headers, you can run them through the network again to get a replay of actual events and see how your equipment performance influenced latency. Another feature in the tool pack will generate extra traffic for you so you can test network performance and latency by adding on services or endpoints.
Pros:
- Supports multiple protocols like NetFlow, great for monitoring Cisco equipment
- Both tools work well alongside each other to help view traffic patterns and bandwidth usage
- Easy to use interface automatically highlights bandwidth hogs and other network traffic outliers
- Scales well, designed for large enterprise networks
- Can view traffic on a per-hop basis, allowing for granular traffic analysis
Cons:
- Built for enterprise use, not designed for small home networks
The SolarWinds Network Performance Monitor also leads in network latency management because it shows live device statuses for all of the network. The tool’s premise is that the network is only as good as the routers and switches that pass through traffic, so its focus on device health quickly identifies capacity problems and enables technicians to take evasive action to head off latency impairment.
Start 30-day Free Trial: solarwinds.com/network-performance-monitor
OS: Windows Server 2016 or later
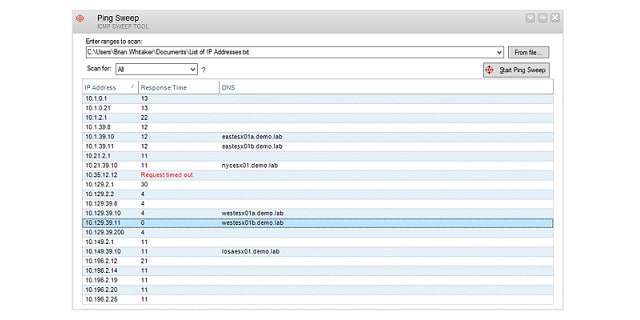
An alternative SolarWinds package of network tools is the Engineer’s Toolset. This bundle of more than 60 utilities includes just about every tool you will need to monitor and manage your network, and the SolarWinds Ping Sweep is part of the bundle.
Key Features:
- On-demand Ping reports
- Shows RTT, packet loss, and jitter
- A suite of network management tools
The Ping Sweep tool, together with the SolarWinds Traceroute, was the first tool produced by the company. So, this is the original SolarWinds network monitoring tool.
The Ping Sweep tool is marketed as a utility for IP address management on networks. However, the output of the tool displays the round trip latency time of every address encountered during the sweep, making it an ideal latency testing & monitoring tool.
The tool has a GUI interface. You enter an IP address range to start a sweep. Every address that lies in the given range is then listed in the output. You can choose to exclude addresses that are found to not be in use. You can also search a non-consecutive list of addresses by loading them into the tool in a file. As well as giving you the response times, this is a great tool for tidying up your DHCP address pool and returning abandoned addresses to make them available again. Sweep results can be exported to XML, CSV, or text files.
Pros:
- Easy to use, doesn’t include any unnecessary ‘fluff’
- Includes a suite of other helpful tools, specifically designed for network administrators and on-site technicians
- Aids in device discovery and testing
- Can help verify DNS and DHCP functionality for different devices
- Can easily export or import results from previous scans
Cons:
- Could benefit from a longer 30-day trial time
The Ping Sweep installs on Windows Server. You can get a 14-day free trial of the entire Engineer’s Toolset.
SolarWinds Ping Sweep with Engineer’s Toolset
Download 14-day FREE Trial
Related post: How to Fix Packet Loss
Site24x7 is a cloud-based platform of system monitoring tools. One of those tools is its Network monitor. This tool is integrated into all of the plans offered by Site24x7. Those plans are:
- Website Monitoring
- Site24x7 Infrastructure
- Application Performance Monitor
- All-in-one
- MSP
The Network monitor has two elements. One is an SNMP-based device performance monitor and the other is a bandwidth analyzer. The traffic analysis module communicates with network devices to extract traffic data. The protocols that the monitor can use are:
- NetFlow
- J-Flow
- sFlow
- CFlow
- IPFIX
- NetStream
- AppFlow
The traffic analyzer is able to display traffic flow volumes per link and it can show those statistics by application and by source and destination, listing the largest traffic generators in each category. This data is available live in the dashboard and it can also be stored for historical analysis as part of a capacity planning exercise.
Key Features:
- SaaS platform
- Network and internet tests
- QoS measurements
Traffic levels can be shown on a time=series graph. Looking at the range of volumes over time lets you see very easily when peaks in traffic volumes occur. Switching data sources to see the flow per application or per source shows where that traffic is coming from. The tool enables technicians to implement Quality of Service traffic shaping measures to help overwhelmed devices.
The network monitoring service includes a series of performance thresholds that trigger alerts if crossed. These alerts appear in the system dashboard and can also be sent to technicians by SMS, email, voice call, and instant messaging post.
Pros:
- Can monitor for latency, bandwidth consumption, and infrastructure problems in a single platform
- Uses real-time data to discover devices and build charts, network maps, and inventory reports
- Is one of the most user-friendly network monitoring tools available
- User monitoring can help bridge the gap between technical issues, user behavior, and business metrics
- Supports a freeware version for testing
Cons:
- Is a very detailed platform that will require time to fully learn all of its features and options
Site24x7 is a subscription service and there are no setup fees or deposits. There is no contract requirement or minimum service period. You can get a 30-day free trial of any of the Site24x7 plans.
Site24x7 Network Monitoring
Start 30-day FREE Trial
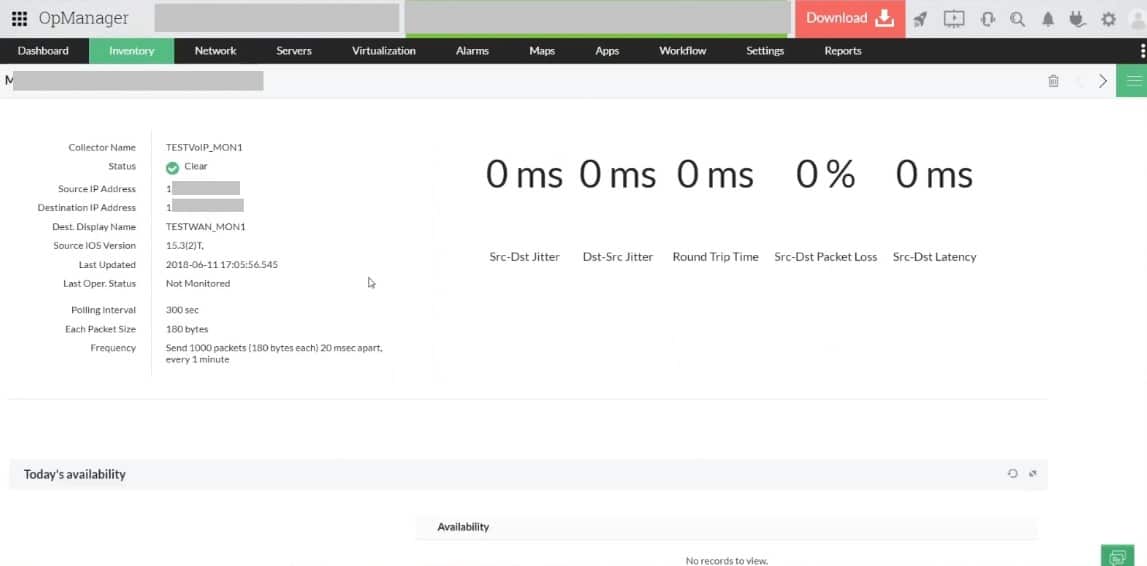
ManageEngine OpManager is a network and server monitoring package that includes the Network Latency Testing Tool. This system is based on Ping and it will give you repeated tests across a network to a specific device or across the internet to check on communications between sites in a WAN.
This system is particularly important for those businesses that use VoIP extensively. Overburdened networks can be tuned to speed up VoIP traffic by queuing the traffic of other applications to let voice packets through faster. However,f this strategy breaks down if you have your telephone system running over the network. In that case, you either have enough capacity or you don’t – shifting traffic priorities won’t help you avoid upgrading your equipment.
Key Features:
- Internal latency tests
- Inter-site connection tests
- Also gives the Mean Opinion Score (MOS)
The full ManageEngine OpManager package provides many other functions, including autodiscovery, device monitoring, inventory creation, and network topology mapping. The software for OpManager will run on Windows Server or Linux. If you have an AWS account, you can find OpManager in the AWS Marketplace to run it there.
Pros:
- Checks on jitter, latency, and packet loss
- Runs across a network or between sites
- Provides performance reports over time
Cons:
- The AWS version is not a SaaS package
Access a 30-day free trial of the on-premises version.
ManageEngine OpManager
Start 30-day FREE Trial
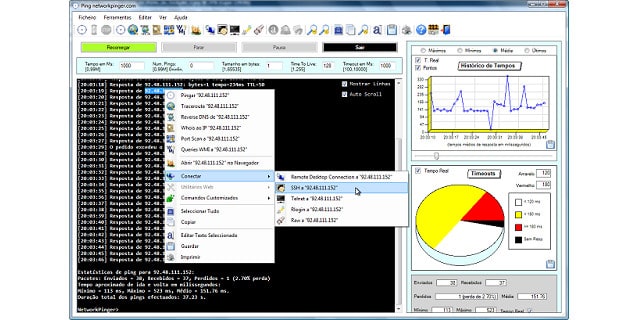
Network Pinger is a free tool that runs on Windows. This simple utility has a great-looking interface that is taken up mainly by a display panel for the results of your sweep. That output is a recursive Ping. It will test all destination IP addresses that lie within the range that you enter as a parameter of the search. Side panels show graphical representations of the data collected by the sweep. These include a pie chart of contact status and a line graph that shows response times. You also get to see the RTT (Round Trip Time) for each contact attempt.
Key Features:
- Free to use
- Manually launched
- Recursive Ping
As well as a Ping function, Network Pinger includes a Traceroute facility that will give you the response times of each hop in a link to a given destination address. The tool also has a switch port mapper. You can contact remote computers through the tool by using the built-in Remote Desktop, SSH, Telnet, and Rlogin utilities.
Pros:
- Can track the pings visually as well as through CLI
- Comes with an IP calculator and switch port mapper, a nice set of features not found in most other ping sweep tools
- Can scan larger networks and filter by subnet
Cons:
- The interface can get cluttered quickly, especially on larger networks
- Not the best tool for long-term monitoring
Related post: Ping Sweep Tools
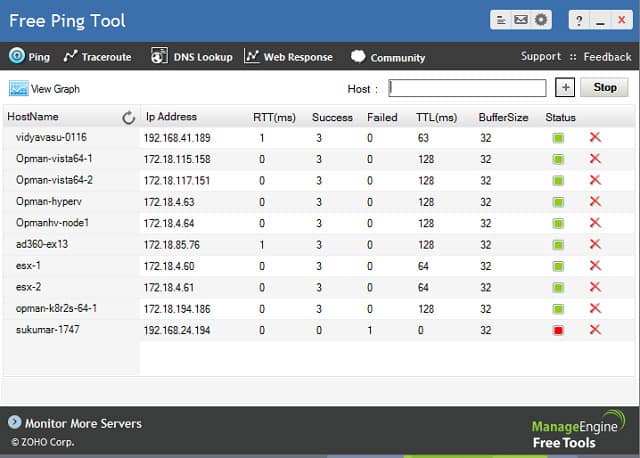
This great ManageEngine utility is actually a Ping and Traceroute tool. The free package also includes a DNS Lookup feature and a specialist measure of response times for websites.
Key Features:
- Free to use
- Ping and Traceroute
- On-demand recursive Ping
The Ping section of this tool shows each of the given hosts and the Ping data for each, including the round trip time. The screen will keep refreshing giving you live updates on the RTTs to your list of IP addresses.
One problem with the tool is that you have to enter each address individually rather than by entering an address range. However, once you have those entered on the screen, they will stay there even when you have to stop the monitor to switch to other utilities. The Ping results can also be shown on a time series line graph.
The Traceroute utility shows you the round trip time on each hop of a route to a given destination and shows a bar alongside. This makes that RTT easy to understand, highlighting the hops that took the longest to cross.
The DNS lookup utility will refer to your local network DNS server, or the closest internet-based server if no local records exist for the URLs that you enter. You can enter either an IP address or a URL as the search term for this utility.
The Web Response tab gives you a nice graph of the response time to the Web server for a given website address. This graph will continue to update and it shows you the RTT broken down between TCP session establishment, redirection time, and web page response time.
This is a great little tool and you can also get reports printed from it in PDF format, which you can save or email.
Pros:
- Easy tool to use, even for non-technical users
- Displays hostname, IP address, and networks statistics in an easy to understandway
- Good for quick on-site tests or small home networks
- Can deploy right from a thumb drive
Cons:
- Not a tool for long term enterprise use
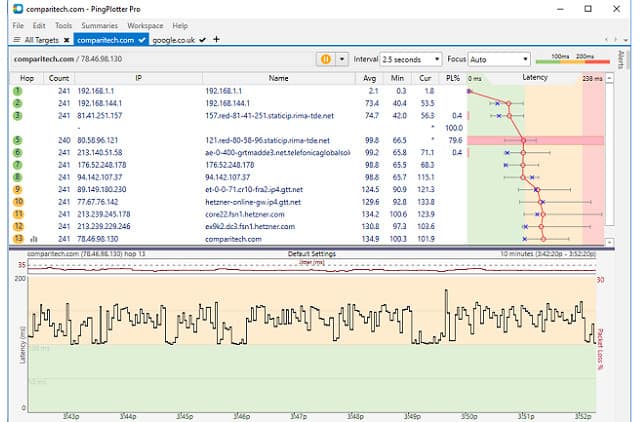
PingPlotter is available in three editions: Free, Standard, and Professional. The free version is actually a 14-day free trial of the Professional edition. All versions of the tool implement Ping and Traceroute, giving results of both tests in graphical format.
Key Features:
- Free version available
- Continuous Ping to one target
- Open multiple sessions in a tabbed interface
The console for the tool has a tabbed display panel, much like a Web browser. For each target, you start a new tab, which shows a list of the hops between your computer and the destination. Tests keep running live and accumulated results for the latency on each hop is shown in three data columns. These show the average, minimum, and current round-trip times for that hop.
A visualization column at the end of each row plots the minimum, maximum, and average RTT on a line. A vertical line graph runs along all of the records in the display which plots the current RTT for all hops. A lower panel in the main screen shows both the latency and jitter for the current connection over time. A summary tab shows you latency results for all currently open network connections in the test system.
This is a great tool that will install on Windows, iOS, and Mac OS. The free version only stores the history for 10 minutes, but the two paid versions show data transmission over an unlimited time frame. The paid versions also include an alerting system and you can choose to run TCP or UDP Ping tests – only ICMP Ping is available with the free edition.
Pros:
- Three options including a freeware version
- Offers lightweight visualization into latency across devices
- Good for both one-off tests as well as continuous testing
Cons:
- Could benefit from a longer trial period
- TCP and UDP tests are not included in the free version
Related post: Best PingPlotter Alternatives
9. NirSoft NetworkLatencyView
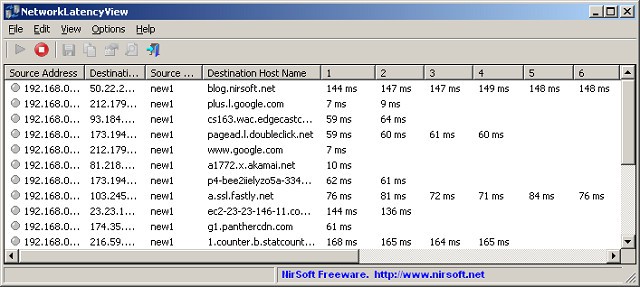
The NetworkLatencyView tool from NirSoft is a little different than all of the other latency testers on this list. Rather than examining links to a given destination, the utility listens for all new TCP connections and monitors while they persist. The reports of the tool are based on Ping, so you will get the same latency feedback that the other tools will give you.
Key Features:
- Free to use
- Identifies new connections
- Implements recursive Ping
This is a free tool and it installs on Windows. The display window can show up to 10 Ping test RTT values for each detected network connection. It also shows the average of those ten tests. This makes the display area very wide. However, you can resize columns, stretch the window, or scroll to the right to see all of the data. Results can be saved to CSV, HTML, XML, tab delimited, or text file for analysis in other apps.
Pros:
- Simple interface, great for identifying latency issues on the go
- Displays hostname, MAC address, IP address, alongside the IP addresses latency statistics
- Can export results in multiple formats
- Is completely free
Cons:
- Does not run on Linux or Mac
- The interface isn’t great for larger networks with dozens of devices
- No graphical representation of latency
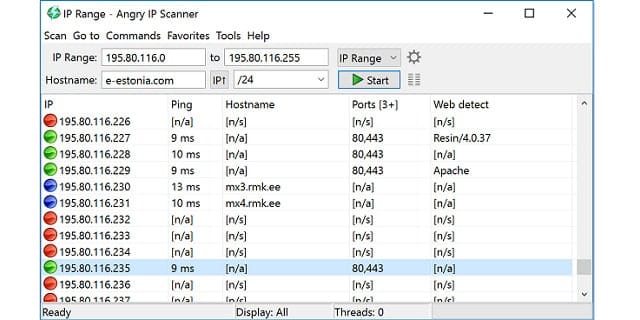
Angry IP scanner is a free Ping utility that will run on Windows, Linux, and Mac OS. The straightforward layout of the interface makes this a useful tool for busy system administrators. You can start a Ping sweep either by entering ‘from’ and ‘to’ IP addresses or by entering a hostname and a CIDR notation offset. It is also possible to enter a non-consecutive list of IP addresses by loading them into the interface from a file.
Key Features:
- Free tool
- Ping sweep on demand
- Port scan option
The tool will ping every address within the given range and show each in the output. This can result in a lot of unused addresses appearing on the screen. You can avoid this large number of irrelevant records by setting in the Preferences section of the tool that only live IP addresses should be shown. This requirement can be refined further by an option that limits the output list to show just those hosts that have open ports.
Tests can be carried out with the classic ICMP message, with TCP, or with UDP. Although the utility will ping many hosts in one run, it will only run each Ping probe on demand. The service does not repeat continuously. If you want to refresh the report, you will need to push the Start button again.
The default output only shows the average RTT for each discovered IP address along with the hostname of that destination and the number of open ports on that device. You can customize the output screen by selecting extra data categories. These include a Packet Loss field.
The number of tests issued is dictated by one of the settings in the Preferences screen. The default number of probes is three per address. The output of a test can be exported in CSV, XML, text or IP-Port format.
Pros:
- Easy to use for both technical and non-technical users
- Great for small networks and home use
- Can output in multiple formats, giving more flexibility than CLI tools
- Offers DNS and hostname metrics
Cons:
- The interface doesn’t scale well on enterprise size networks
- Lacks graphing capabilities
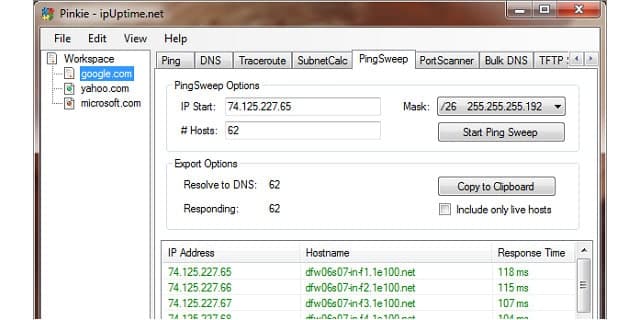
Pinkie is a suite of network monitoring tools that includes a Ping sweep option. The tool is free to use and will run on Windows.
Key Features:
- A group of network tools
- Ping on demand
- Free tool
The tool also includes a straightforward Ping option, which will probe just one destination IP address, which can also be entered as a URL. This feature will continue to issue Ping packets to the target, showing the RTT and also the ‘time to live’ setting entered in each probe packet.
The Ping Sweep option will test a range of addresses. However, the test is not continuous and you have to relaunch the utility by pressing a Start Ping Sweep button to get the results refreshed. A checkbox in the search section of the screen enables you to exclude IP addresses that are not live. The results in this screen show the IP address, the hostname, and the RTT of that probe. The Ping Sweep output can be copied to the clipboard and then pasted into a text file.
Other utilities in Pinkie are a port scanner, a Traceroute implementation, a DNS lookup function, and a bulk DNS reference facility, which uses a list of addresses from a file. There is also a subnet calculator and a TFTP server in the bundle. This is a very useful pack of tools that help you keep all of the facilities you need to check on your entire network in one interface.
Pros:
- Completely free tool
- Simple to use – good option for home users
- Can find addresses as well as report on external domains and servers
Cons:
- The interface is clunky, using arrows to show tabs that get hidden on the toolbar
- Lacks graphical tracking
- Limited reporting options

NetScan Tools Basic Edition is a free set of network testing tools that runs on Windows. The tool is free because it is supported by advertisements. If you want to get rid of those ads, you can buy NetScan Tools Pro. You get three Ping-based utilities in both editions of NetScan Tools. The package also includes a Traceroute facility, so you have four ways to test the latency of your network.
Key Features:
- Free but ad-supported
- Single Ping or recursive Ping
- On-demand system
The first of your Ping options is a straightforward graphical interpretation of the standard command. You enter a domain name, a hostname, or an IP address and the tool will send out five Ping probes to that destination. The output will show the RTT and time to live of each probe. You can alter the number of network packets sent in each run in the Settings menu.
A Graphical Ping option shows a constantly-executed Ping test to a single destination. Again, that target can be specified by hostname, domain name, or IP address. The test will keep repeating until you choose to stop it – even continuing when you move away from this screen to try a different utility. The line of the graph shows the RTT of each attempt.
A Ping Scanner lets you test a range of IP addresses. The output will show the results of a Ping test to every address within the given range. However, you can select to cut out non-responding addresses. The results include the IP address, the hostname, the round trip time, and a status report for each address in the range. A context menu on this screen is available when you click on the right mouse button. This enables you to print the output of the test or save it to a file.
The Traceroute tool gives you another view on your network latency. This shows every hop between your computer and a given destination address. The RTT of each hop is shown alongside the IP and address of each intermediate router. This command will run once. You have to reissue the command if you want to get an update on the speeds of each link in the connection.
Other tools in the pack are a DNS lookup feature and a Whois query tool.
Pros:
- Offers a paid and free version, making it accessible for any budget
- Lightweight, the tool can be run on practically any endpoint
- Uses DNS queries to test name resolution and address scanning
Cons:
- The interface can feel outdated and a bit cluttered when scanning larger networks
- Only available for Windows operating systems
Although there are many different methods for measuring latency on your network and across the internet, Ping is the most commonly-used utility to test connection speeds. As you can see from our list of options for testing latency, all companies producing network monitoring tools for speed tests make sure to include a Ping tool in their applications.
In this guide, you have read about ten alternative tools that will provide you with latency testing facilities. Your first task, when narrowing down this list, is to examine the operating systems that each option will run on and only focus on those that run on the system on which you want to run your monitoring facilities. Fortunately, all of the latency monitoring tools on our list either have a free version, a free trial, or are completely free to use. Many of the tools are very lightweight and don’t take up much disk space, so you can download a few of them to compare their performance.
Do you test your network latency frequently? Which tool do you use? Do you rely on the standard command-line Ping? Have you tried any of the tools listed in our guide? Leave a message in the Comments section below and share your experience with the community.
How to Test for Network Latency FAQs
What is latency in the cloud?
Cloud latency is the time that passes between a client issuing a request and a cloud service launching a response. As the path from a client to a cloud server involves the public medium of the internet, the issue of latency in the cloud is difficult to resolve.
How do I locate WAN latency issues?
WAN latency involves measuring transmissions over three networks: the home network, the remote network, and the linking network, which could be a fixed link but is usually the internet. Network administrators have greater control over the business-owned networks wherever they are located. Identify the cause of WAN latency by testing in-house network speeds first. If they are working at peak performance, the internet link is the cause of your transmission delays.
What is application latency?
Network latency examines the speed of transmission between devices. Application latency adds on an examination of the speed of delivery of a service within the server and the processing ability of the receiving endpoint.
Can network mapping spot latency?
Network mapping is a monitoring and management tool. A straightforward network topology map is a picture, which can help administrators to spot possible bottlenecks just by working out how much traffic needs to run along each link. However, monitoring tools add live traffic data to the diagram. Accumulating actual traffic flow data is the most accurate way to identify overloaded devices and links and that leads to more effective capacity planning and traffic shaping strategies.


![Toni Kroos là ai? [ sự thật về tiểu sử đầy đủ Toni Kroos ]](https://evbn.org/wp-content/uploads/New-Project-6635-1671934592.jpg)


